To overlay 3D plots (simultaneously viewing multiple plots with similar range
on the same axes system)
- Select column to be plotted on the X-axis.
- Select column to be plotted on the Y-axis.
- Select column to be plotted on the Z-axis.
- Click on "3D Scatter Plot" icon
 plot3d of the toolbar.
 - Select column to be plotted on X-axis (represents another plot).
- Select column to be plotted on Y-axis (represents another plot).
- Select column to be plotted on Z-axis (represents another plot) .
- Set the "Overlay" option.
- Click on "3D Scatter Plot" icon plot3d of the toolbar.
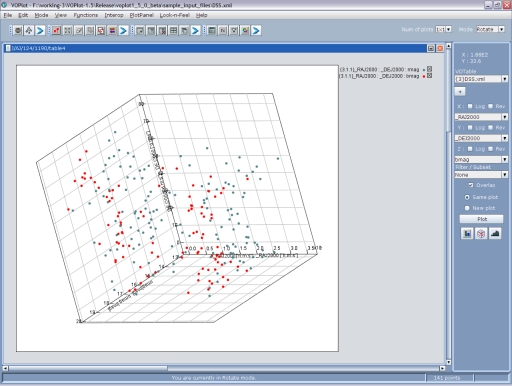
A different marker will be used for each plot, to allow one to differentiate between the plots.
Example of overlayed 3D Scatter Plot is shown in Figure 1