The VOTable data used for plotting can also be displayed in tabular format. It also displays the filters and data sets that are user-defined.
To view the
VOTable data, click on Data in Table format submenu from the
View menu or Data in Table format icon ![]() .
The Display VOTable Data in Tabular format dialog box will open.
.
The Display VOTable Data in Tabular format dialog box will open.
The dialog box has a VOTable menu combo box and a filter combo box. By default the first VOTable loaded is selected. The data is displayed in two different tables. The first table displays the field metadata of the VOTable, while the second table displays the actual data. If the table has been plotted on the active plot with some points selected then only the data related to the selected points is shown.
To see the data of the VOTable of your choice you can change the selections in the combo box and click on the "Show" button.
You can use the filter combobox to select a subset. Clicking show will show data in that subset only
A sample dialog box displaying the data and metadata of a VOTable is shown in Figure 24.
Figure 24
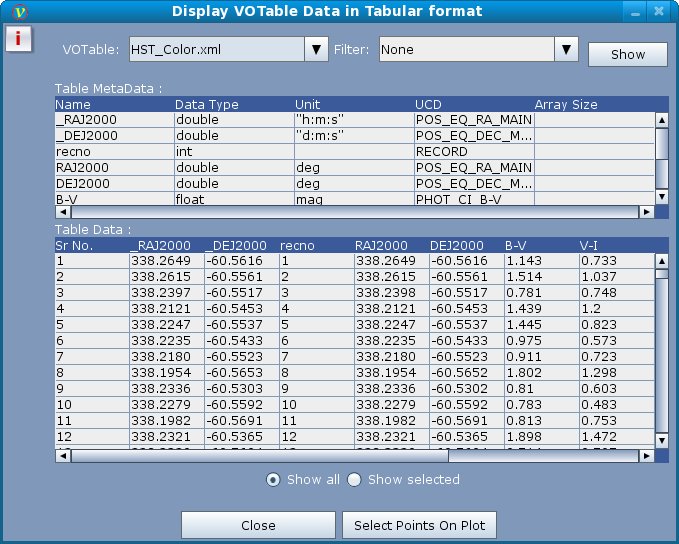
Selected Data:
To view the tabular data of the points selected on the active plot, select the radio button Show Selected.
Entire Data:
To view the tabular data of all the points in the VOTable, select the radio button Show all.