Projection plots are mappings from RA/DEC (or Long/Lat) positions of objects on the 3D celestial sphere to a flat 2D map for ease of visualization. Depending upon the requirements, different projection types can be used.
The following three types of projections are supported by VOPlot:
- Sinusoidal Projection
- Aitoff/Hammer Projection
- Mollweide Projection
A projection plot in VOPlot can be seen by clicking on the View --> 2D Plots --> Spherical Projection Plot menu item or the projection plot button ![]() on the main launcher.
on the main launcher.
Changing the type of Projection:
The projection type can be changed by selecting the required projection type from the Projection combo box from within the plot window.
Changing the Center of Projection:
The center of projection is the coordinates of the center point of the projected sphere. We can see the projected points from different positions such as Standard, North Pole and South Pole by changing the center of projection. The center of projection can be changed by selecting the required center type from the Center combo box.
Sample Projection Plots for each of the above three projections are shown in Figures 26, 27 and 28 respectively:
Sinusoidal Projection:
Figure 26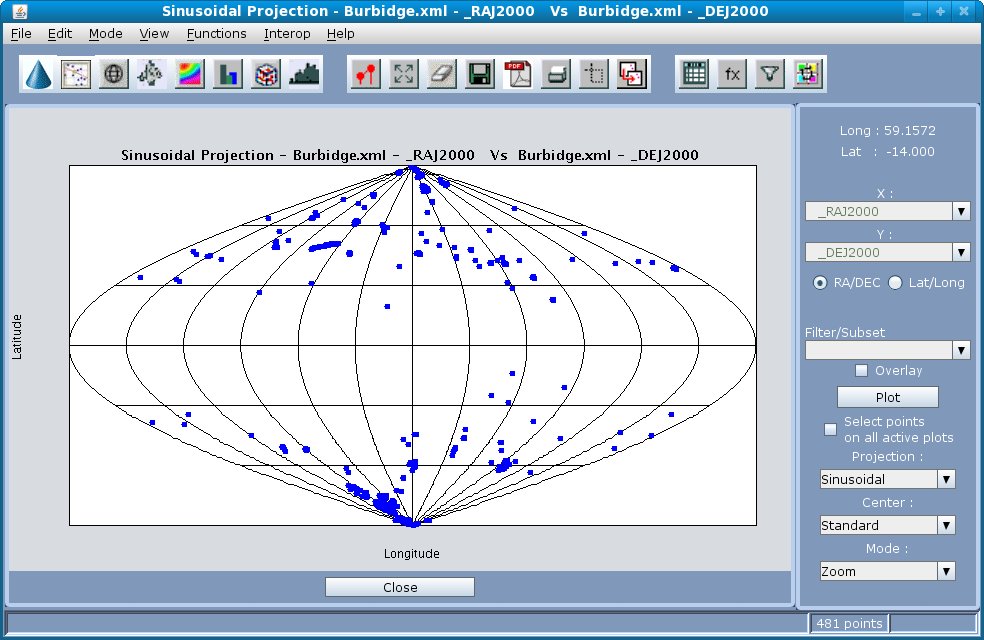
Aitoff Projection:
Figure 27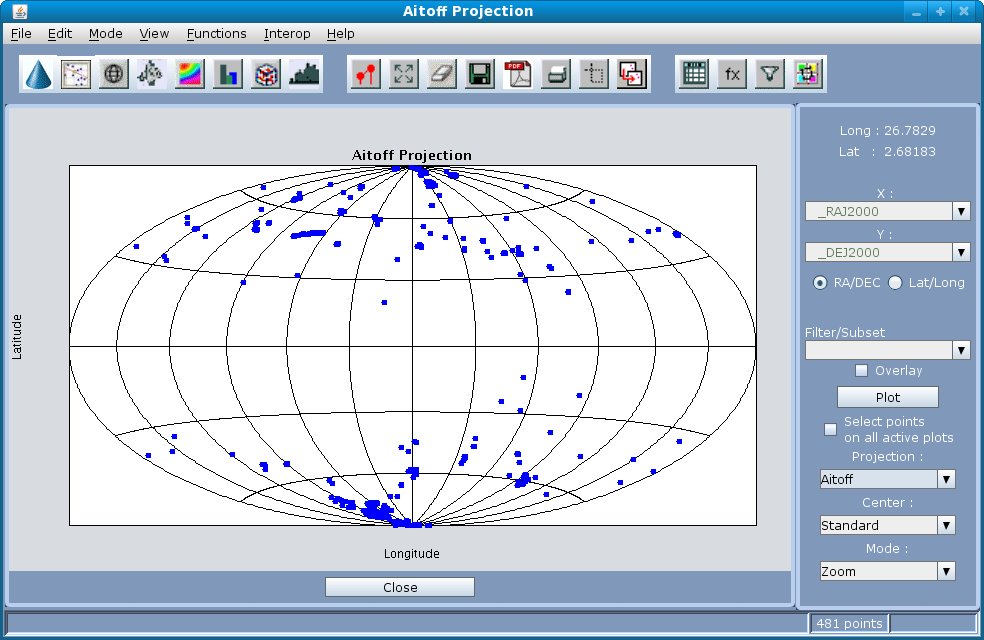
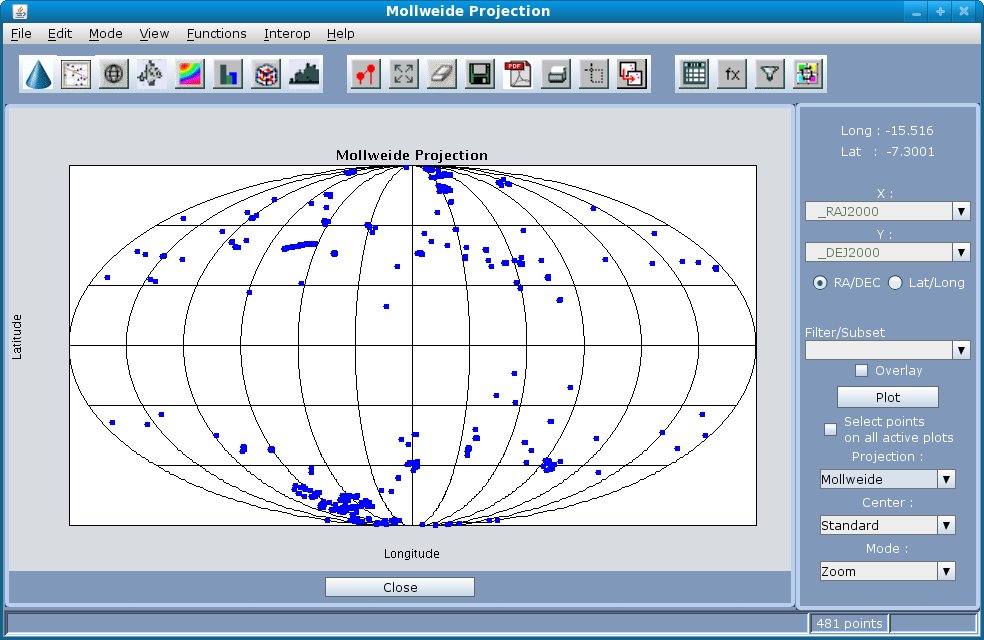
Mollweide Projection:
Figure 28