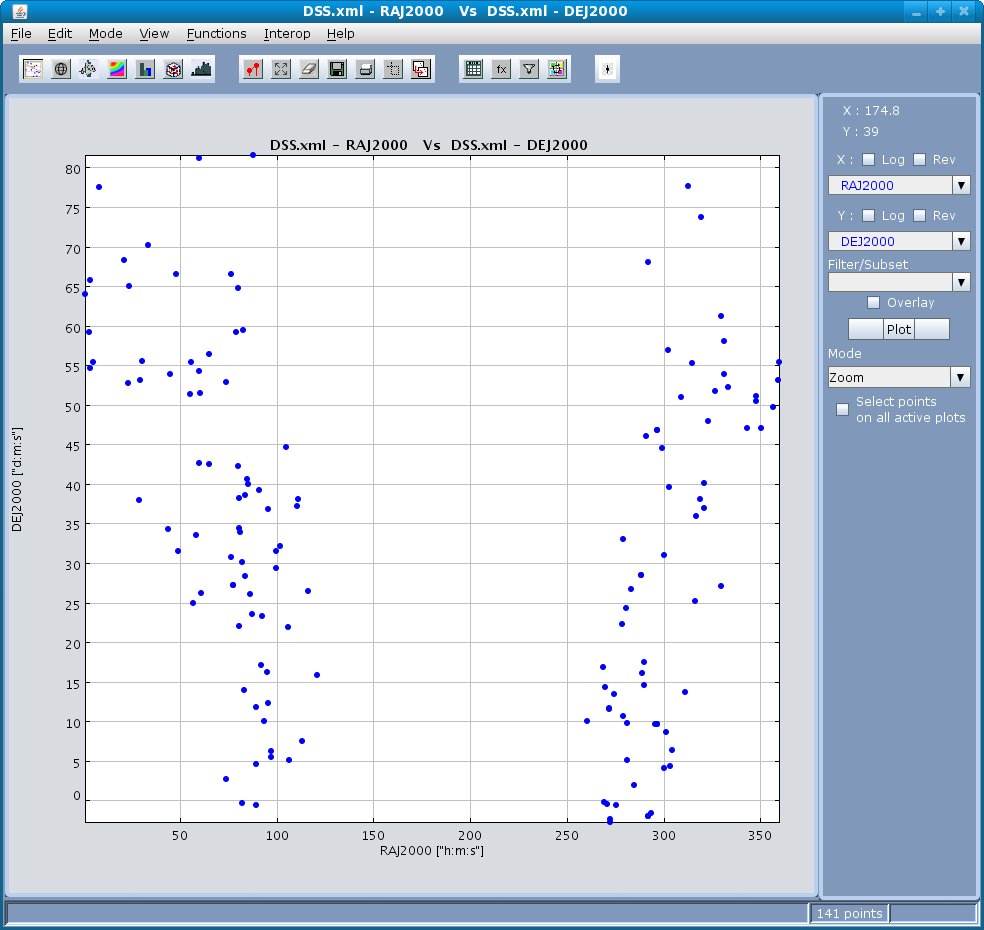
Click on View --> 2D Plots --> Scatter Plot to obtain an empty canvas for drawing a 2D scatter plot. You can also do the same by clicking on the 2D scatter plot icon on the main launcher ![]() .
.
Now, to draw a plot of one column against the other,
- Select the column to be plotted on the X-axis.
- Select the column to be plotted on the Y-axis.
- Click "Plot" button.
You can see the scatter plot.
Note that VOPlot 1.6 allows you to plot a column from one VOTable against column from another VOTable as long as the number of rows in the two VOTables are the same. The responsibility for ensuring a one-to-one correspondence between the rows of the two VOTables lie with the user.If required, you can plot data points on a log scale by setting the option appropriately using the "Log" checkbox. Also, by checking the "Rev" checkbox, the data points are plotted on a reverse scale.
Scatter plot uses pixels for plotting if the number of points is more than 100000.
Figure 5