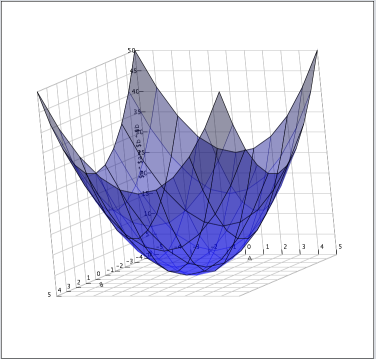
To draw a surface plot using an equation
- Click on the Surface Plot icon
 on the main launcher. (This will open the 3D surface plot window).
 - Click the Plot Surface from Equation icon
 inside the 3D Surface Plot window.
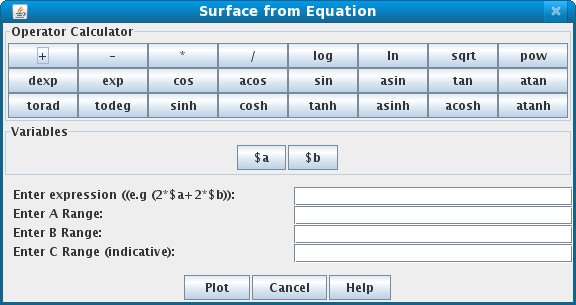
This launches an equation maker dialog.
 - Enter the equation in the equation maker dialog. We use $a and $b as variables. Eg: sin($a)*sin($b)
- Then enter the ranges for a, b and c. While variables a,b are the independent variables (the XZ plane), c is the dependent variable defining the height of the surface at a given (a,b). The range for "c" is indicative. The actual range may differ. User can play around with the Y range using the PlotProperties dialog after the surface plot has been drawn.
- Click Plot button to draw the surface.
