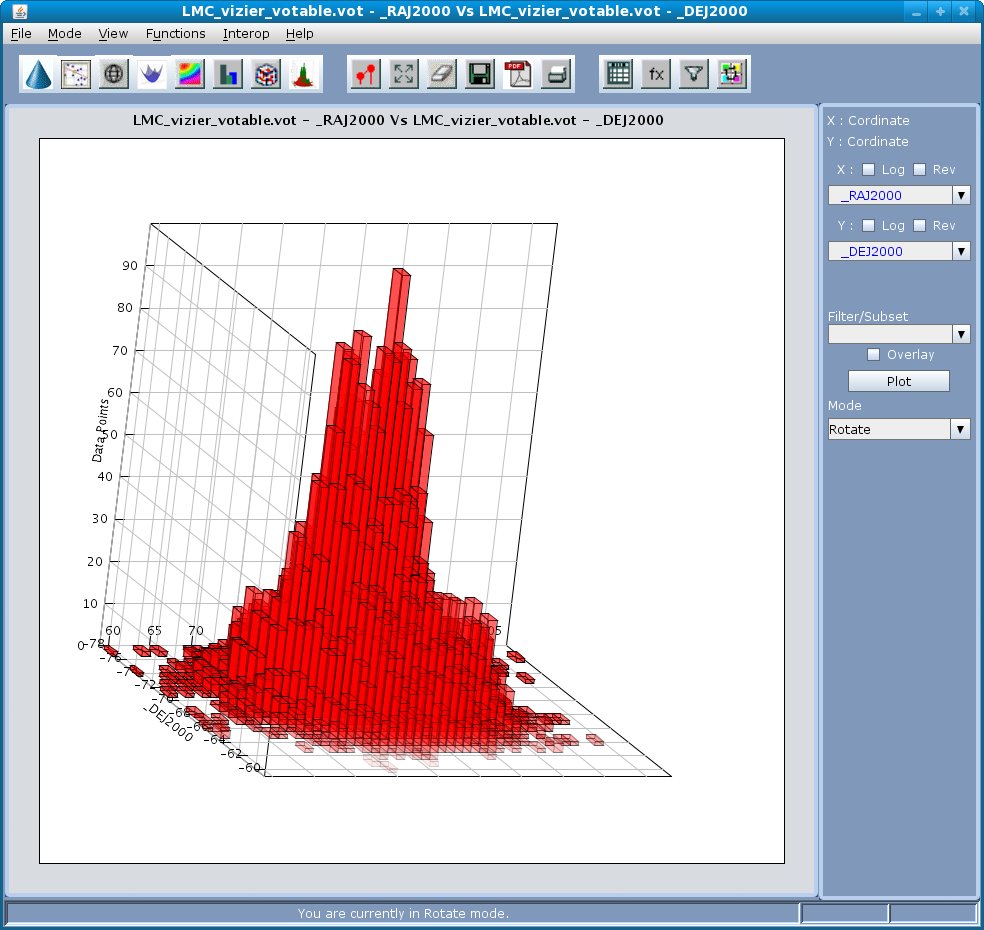
To plot the 3D histogram using two columns click View --> 3D Plots --> 3D Histogram plot from the main VOPlot launcher or click on the 3D Histogram plot icon  .
.
- Select the column on X-axis.
- Select the column on Y-axis.
- Click the plot button.