To change the plot properties click on the View --> Plot Properties
menu or the plot properties icon ![]() , this opens the Plot properties dialog shown in the Figure below:
, this opens the Plot properties dialog shown in the Figure below:
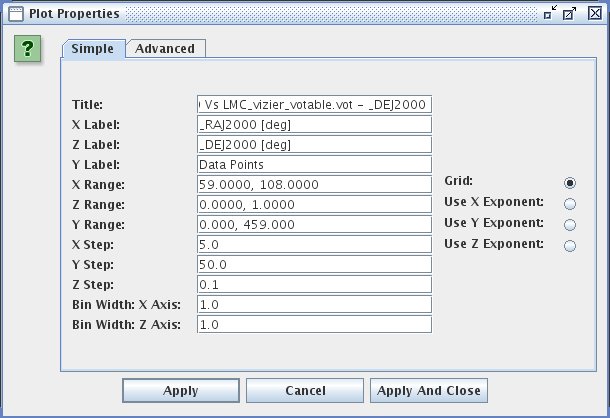
For changing properties such as title of the plot, labels, and ranges, click on the Simple tab.
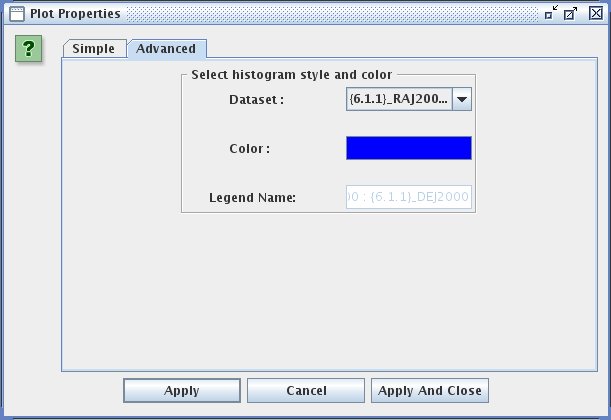
For changing properties such as color or legend etc. click on the Advanced tab.
- Selecting a particular dataset in Dataset combobox and changing color will change the properties of only that particular dataset.
- Selecting All Datasets in Dataset combobox and changing color modifies the same for all the plots overlayed (if any) and plots that might be overlayed in the same plot panel subsequently.
When All Datasets is selected in Dataset combobox, an option to Apply changes to All Plots is available. Enabling this feature applies property of respective plot panel to all the plot panels present with histogram plotted and even that might be created subsequently.
To use transparent colors vary the alpha value in the color chooser box which pops up by clicking the colored button with label Color: