To view a 3D scatter plot click View --> 3D Plots --> 3D Scatter Plot from the main VOPlot launcher or click on the 3D Scatter plot icon  .
.
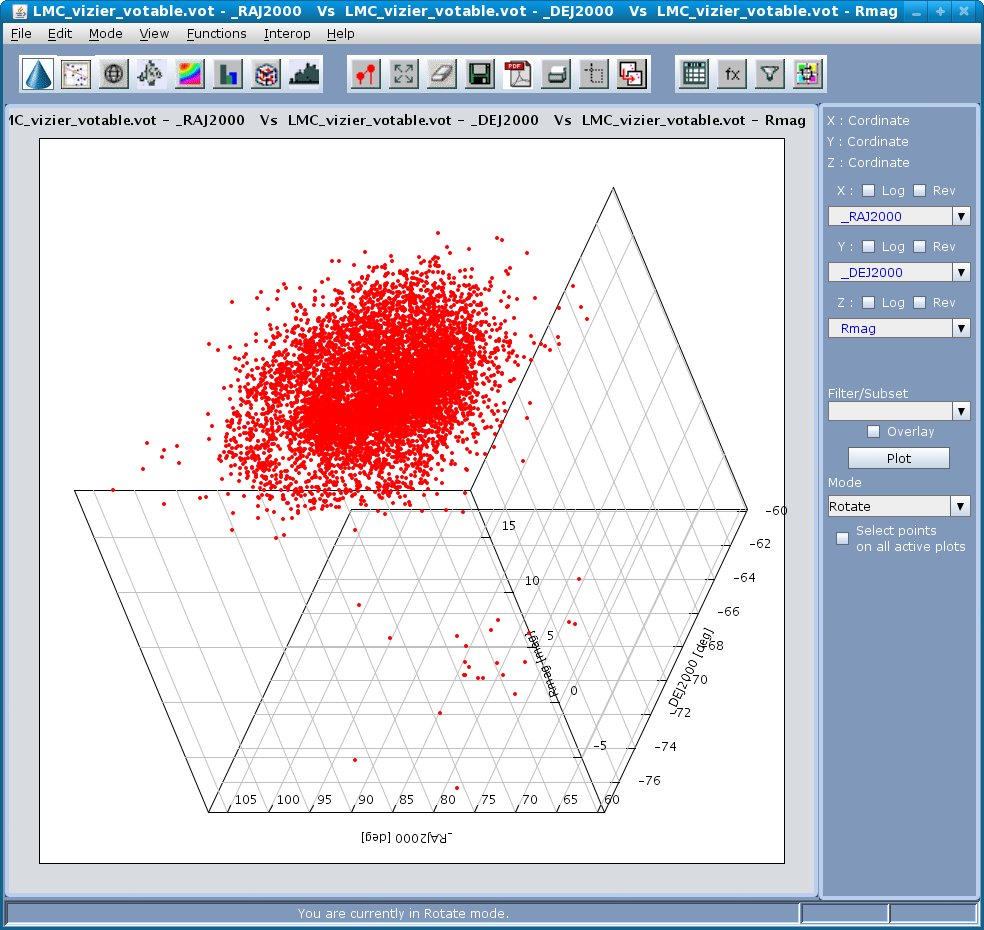
- Select the column to be plotted on the X-axis in X: labeled combobox.
- Select the column to be plotted on the Y-axis in Y: labeled combobox.
- Select the column to be plotted on the Z-axis in Z: labeled combobox.
- Click the Plot button.
A sample 3D scatter plot is shown in the figure below:
To apply overlay, log and reversed axis functionalities refer to the related concepts below