To view density plot click View --> 2D Plots --> Density Plot from the main VOPlot launcher or click on the density plot icon![]()
To draw the density plot of one column against another:
- Select the column on X-axis.
- Select the column on Y-axis.
- Click on "Plot" button.
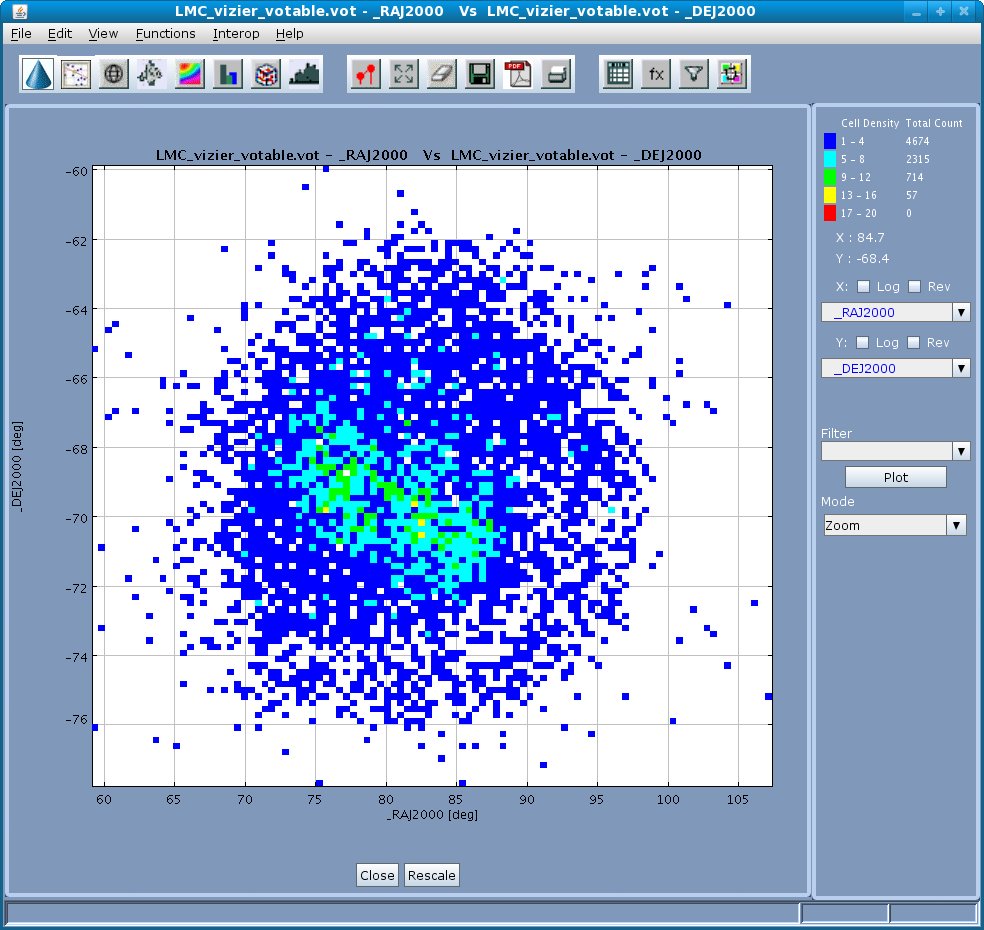
The color-coded density table is given at the top right side of the plot window.