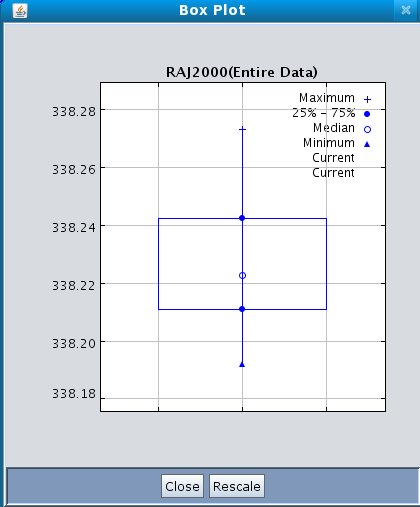
A Box plot provides an excellent visual summary of many important aspects of a distribution. It identifies the middle 50% of the data, the median and the extreme points.
Click on the Box Plot button on the Plot statistics dialog to display the Box Plot for the X column.
A sample Box Plot is shown in Figure 22 below.
Figure 22