You can create data subsets by defining filters on them. You can use a condition with relational and/or logical operators on various columns to create new data subsets which can then be used for plotting.
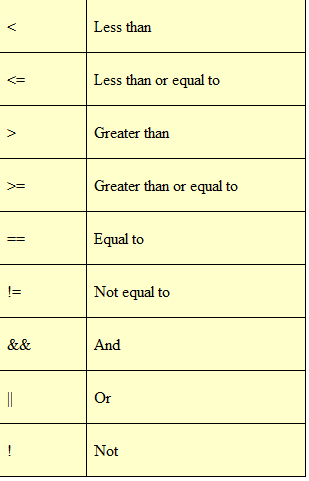
Operators Allowed
Creating new data subsets
- To define new data subsets on columns, click on the Create Filters icon
 or the Create Filters submenu from the Functions menu to display the Create new data subsets dialog box.
 - In this dialog box, you can see the column names, UCD and their Id (used for expression building) and the expression with which they were created in the first table (if any). It also shows the data subsets that you had previously created along with their names and conditions. All these correspond to the table selected in the VOTable drop down combobox in same window
- For creating a new data subset, type in the new subset name (example f1Glat) and the filter definition using the functions and relational operators shown in table above. You can also make use of arithmetic operators and functions listed for Transformations on columns.
- The expression can also be formed with the help of Operator Calculator as shown in the following figure. When you click on a row present in the Column Metadata, then the corresponding Column Id appears in the text box for Enter expression. By clicking on any of the buttons in the Operator Calculator, the corresponding operator or function appears in the text box for Enter expression. This feature eliminates the need of typing in the expression and allows for easier creation of the expression.
The dialog box for creating data subsets is shown in Figure 18.
Figure 18

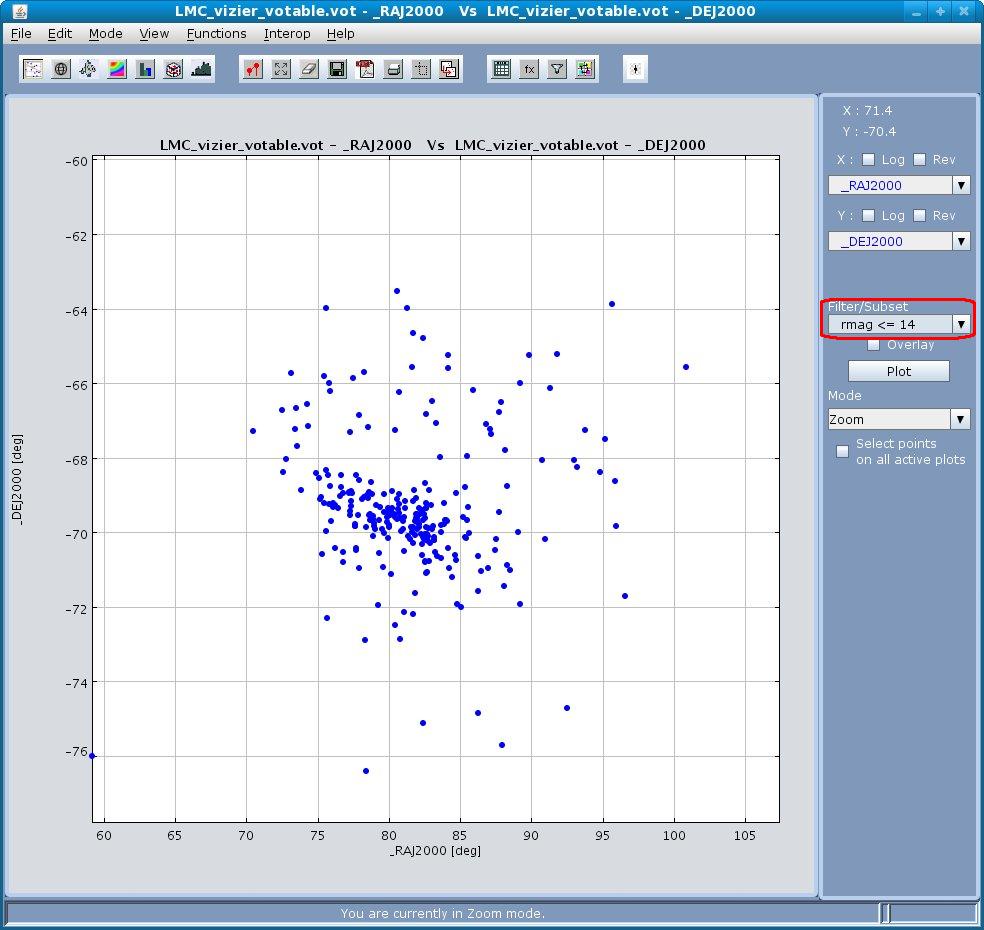
Once a data subset is created you can plot data from the subset. This can be done by choosing the data subset from the Filter/Subset combo box in the plot window (encircled in red in Fig 19 below). Only data points satisfying the filter condition will be considered for plotting as shown in Fig. 19 below.
Figure 19 RA Vs Dec plot for LMC stars. Only stars brighter than 14th R magnitude are plotted.