Used to display Plot data in VOTable format. It also displays the filters and data sets that are user-defined.
Displaying the VOTable:
To view the VOTable, click on Data in VOTable format submenu from the View menu. The Display data in VOTable format dialog box will open. The dialog has a VOTable drop down menu combo box. By default the first votable loaded is shown. If the table has been plotted in the active plot with some points selected then only data related to those points are shown. You can select the VOTable which is to be displayed from the combo box and click the show button. The filter combobox can be used to only see data corresponding to a subset/filter created previously
Selected Data:
On selecting Display Selected Points only check box you see data related to the selected points in the active plot. Unchecking would show all the data.
Note:The data displayed is truncated to the first hundred points.
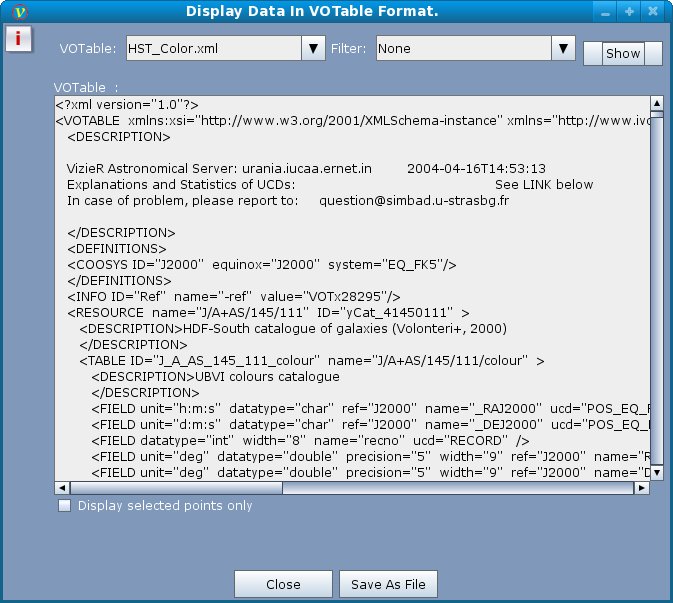
Sample dialog box displaying a VOTable is shown in Figure 23 below.
Figure 23
Save VOTable:
This feature is available only in the desktop version of VOPlot. To save a VOTable, click on Save As File button on the dialog box. The save as dialog box will appear. Choose a filename/location on disk and click OK. The file will be saved as an XML file, VOTable format. The various user-defined filters and data columns pertaining to all points (including greater than 100) are saved in the file.
Note: This feature is not available in the web-based version of VOPlot.