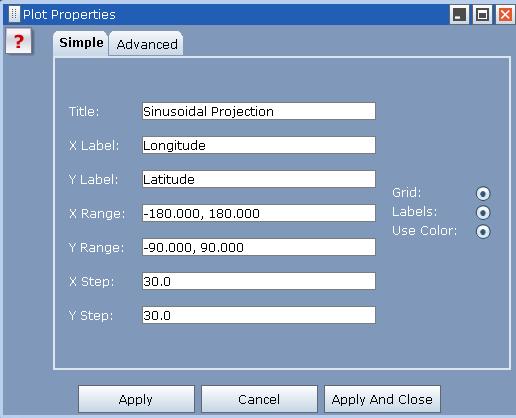
The attributes of the projection plot such as labels etc can be changed by going to View --> Plot Properties or clicking on the  button as usual.
Click on the Simple tab to change properties like the longitude, latitude, range, etc.
Figure 11

The labels can also be changed using the buttons on the right hand side of the frame
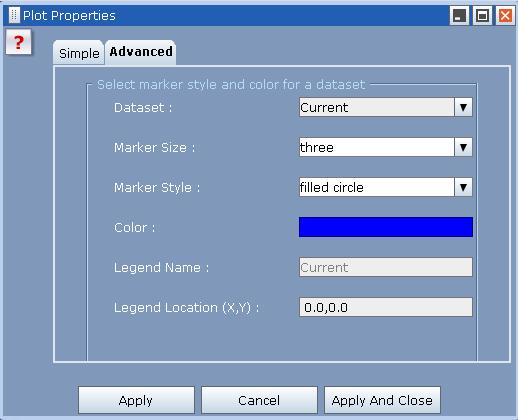
Click on the Advanced tab to change the color of the projection points or change the type of projection etc.
Figure 12
