Applying Statistical Functions
- To apply statistical functions, click on Generate Statistics icon
 or Generate Statistics submenu from the Functions menu. The Plot Statistics dialog box will open.
 - You can choose the data subsets from the filter combo box if required.
- Select X and Y columns and click the Calculate button. Note: Default columns are picked up from the X and Y column drop down menus in the main plot window. The results are displayed on the same window.
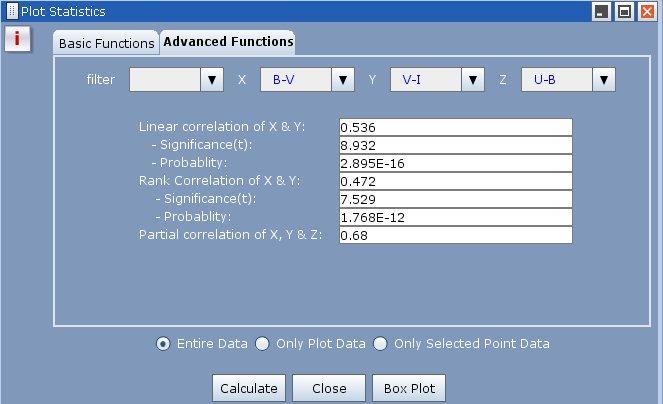
The dialog box is divided into two tabs basic and advanced functions. The basic functions perform the calculations for each data array (column) separately, while the advanced functions require two or three data arrays (columns) to perform the calculation.
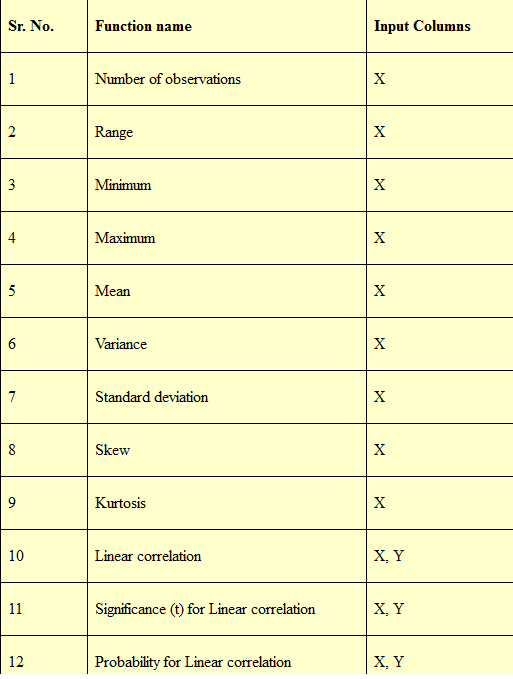
The following statistical functions are currently supported.
VOPlot, by default, takes only the plotted data range into consideration while evaluating the statistical functions. This will evaluate the statistical functions for the currently selected columns, along with the applied filter, if any, corresponding to the plotted points. However you can force it to consider complete dataset by selecting the Entire Data checkbox.Similarly, you can force it to consider only the selected data points by selecting the Only Selected Point Data checkbox
Sample dialog box with basic tab selected showing plot statistics is shown in Figure 20.
Figure 20

Sample Advanced Functions tab is shown in Figure 21.
Figure 21