To draw the surface using an equation
- Click on the "Surface Plot" icon Image surface of the toolbar.
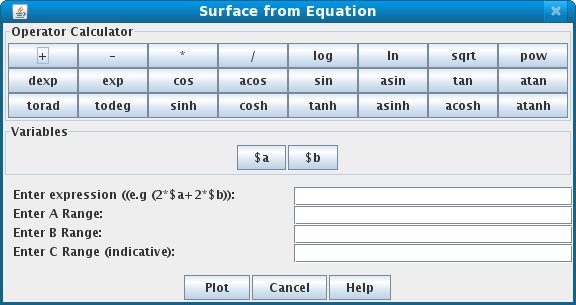
- Click the Equation icon Image stat in the toolbar of the Surface Plot Dialog. This launches an equation maker dialog.
- Enter the equation in the equation maker dialog. We use $a and $b as variables. Eg: sin($a)*sin($b)
- Then enter the ranges for a, b and c. The range for "c" is indicative. The actual range may differ. User has to play around with the Y range a little bit using the PlotProperties dialog (launched by clicking Image format on the toolbar of Surface Plot dialog) after the surface is drawn . While variables a,b make the XZ plane, c defines the height of surface at an (a,b) on the Y-Axis
- Click Plot button to draw the surface.
Figure 1 below shows the Equation maker dialog