To draw the histogram of one column against another,
- Select the column on X-axis.
- Select the column on Z-axis.
- Click on "3D Histogram"
 Image histo3d of the toolbar.
A sample histogram is shown in
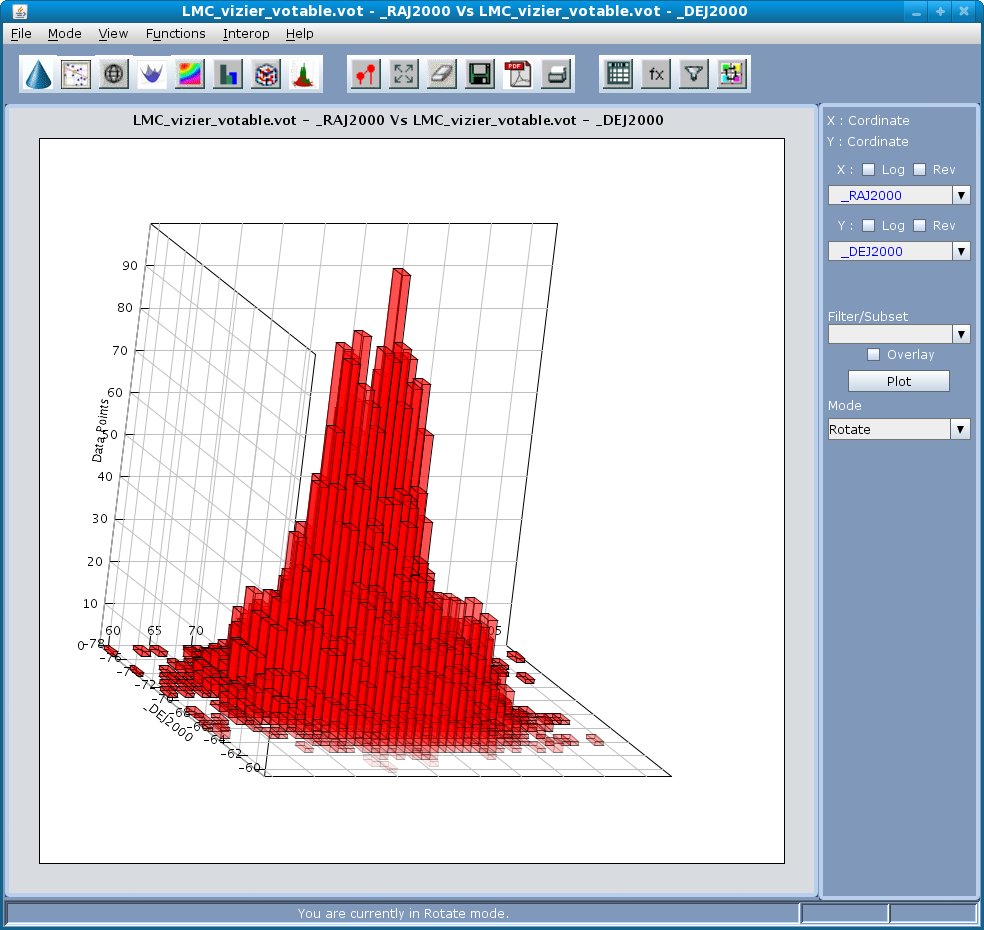
To apply overlay,log and reversed axis functionalities refer to the related concepts below