To draw a 3D plot of three different columns,
- Select the column to be plotted on the X-axis in "X: " labeled combobox.
- Select the column to be plotted on the Y-axis in "Y: " labeled combobox.
- Select the column to be plotted on the Z-axis in "Z: " labeled combobox.
- Click on "3D Scatter Plot" icon
 plot3d of the toolbar.
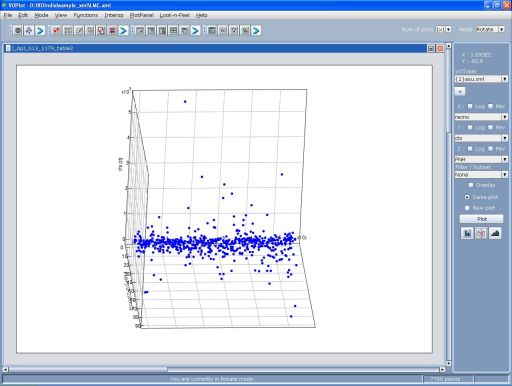
You can see the 3D scatter plot in Figure 1
To apply overlay,log and reversed axis functionalities refer to the related concepts below