AstroStat (Version 1.0 Beta)
Statistical Analysis for the Virtual Observatory
|
AstroStat (Version 1.0 Beta) Statistical Analysis for the Virtual Observatory |
The standalone version of the AstroStat (Statistical Tool) is a java based tool allowing astronomers to use both simple and sophisticated statistical routines on large datasets. It's web-based version is available at http://voi.iucaa.ernet.in:3080/astrostat. The standalone version can be downloaded from http://vo.iucaa.ernet.in/~voi/AstroStat.html.
Click here for disclaimer information.
Third Party Tools
1. AstroStat makes use of a large public-domain statistical computing package called R.
2. AstroStat makes use of SAVOT parser for parsing of the VOTable files.
The standalone version requires R-2.15.0 or higher version to be installed on the local machine.
System Requirements
Java : To run AstroStat you must have JRE 1.6 or higher version
To check version of java on your machine, you can use the following command on the command line
java -version
R: R-2.15.0 or higher version is to be installed on local machine.
Installed R location
In Windows operating system, the default location of R executable is "C:\Program Files\R\R-2.15.0\bin\R.exe"
In Linux operating system the user can find the location of R executable by typing command "which R" on the terminal.
Starting Instructions
To use the standalone version of AstroStat, you will need to download and extract the zip file AstroStat.zip. The extracted folder will contain folder 'binaries', which in turn will contain an executable jar file named 'AstroStat.jar'. The file can be executed by typing the following command at the command prompt.
java -jar AstroStat.jar
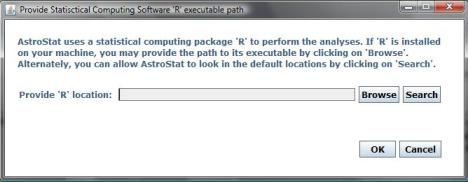
Running the application for first time opens a input dialog asking for locally installed location of R (path of R executable) as shown in the Fig. 0. The prerequisite to run AstroStat is software R which should be already installed on the machine. You can either click on "Browse" to browse your local directory to locate the R executable, or you can use the "Search" option, wherein AstroStat will look for the R executable in some default locations in your filesystem. After validating correct R path, a java application window will be open as shown in the Fig. 1.
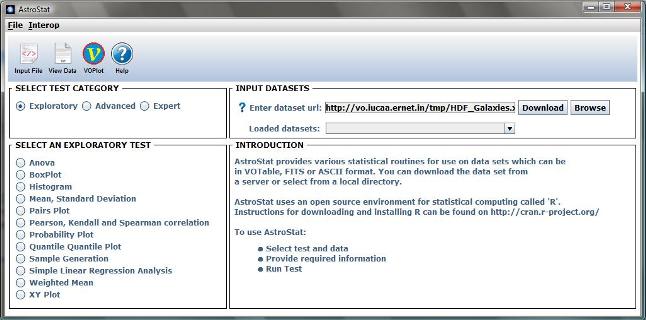
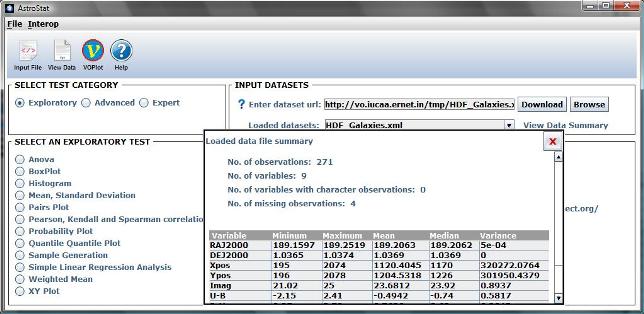
To perform statistical computations, you will need to load input datasets first. Datasets can be uploaded in either ASCII or VOTABLE format. You can specify either the URL of dataset and click "Download" or specify the path of a dataset on your machine by using the Browse button. Oncethe dataset is loaded, the name of valid input dataset will be displayed "Loaded DataSets" drop-down box. A "View Data Summary" label will be displayed next to it. Moving your mouse pointer over it will display metadata related to the currently selected dataset, as shown in Fig. 2.
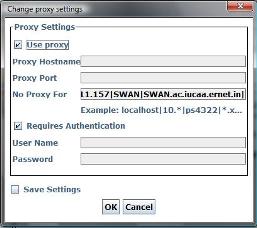
Users can load files from an online resource by specifying the address in the 'URL' field. If unable to connect to the internet, a small dialog will be displayed as shown in Fig. 3 asking for the network proxy settings, if any. Specify Address and Port number for proxy settings otherwise cancel the proxy window for no proxy. A small progress bar will be displayed indicating getting the file from the specified URL. After getting the valid file from URL, name of file will be displayed in the "Loaded datasets" drop down box
Figure 3
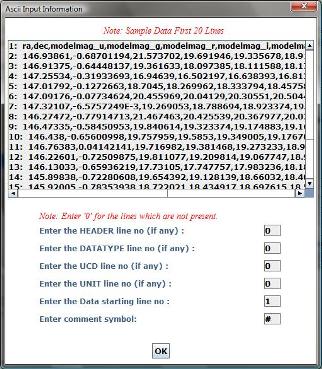
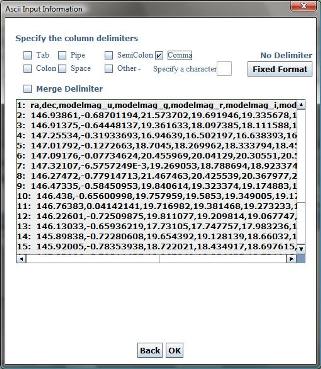
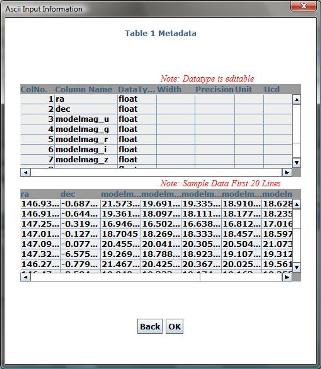
If the file being loaded is an ASCII file, then AstroStat will present the user with a "Load ASCII File" dialog, where the user is asked to confirm the metadata of the file to ensure the parsing is done correctly.
Sample screens are shown below.
|
Figure 4
|
Figure 5
|
Figure 6
|
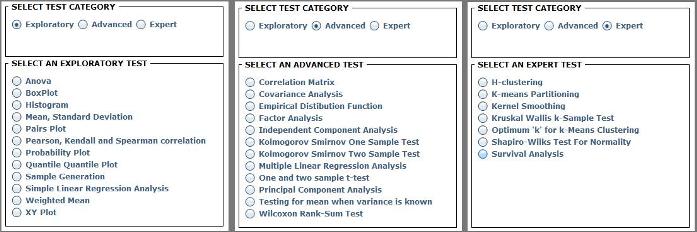
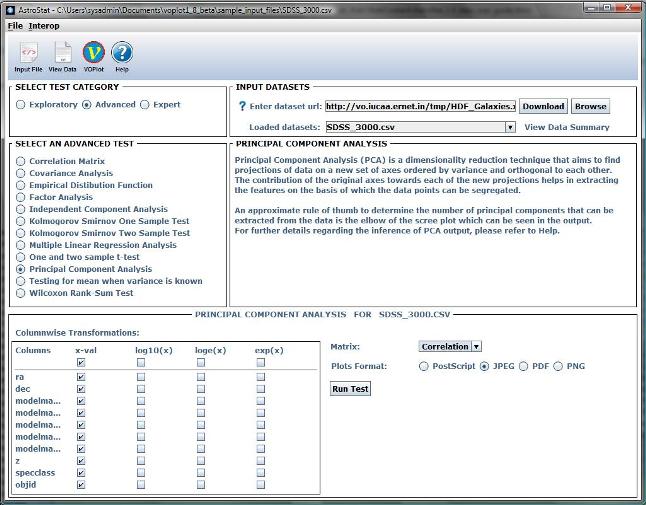
The statistical routines are broadly classified into three categories based on their complexity, namely, Exploratory, Advanced and Expert. On selecting one of these categories, a list of tests will be displayed in the panel below it. Fig. 7 depicts the three categories and the tests listed under each. You can now proceed to select particular test.
Figure 7
Once you select a particular test, the AstroStat application window will resize and a new panel will be displayed at the bottom. This panel will allow the user to specify input parameters specific to the selected test, as shown in Fig. 8. If the test generates any plots, the format of the images can also be specified.
Figure 8
A brief introduction to the selected
test will also be displayed in the "Introduction" panel. For a more detailed documentation
of the tests, click the  icon on the
shortcuts toolbar. This will display the helpset in a browser as shown in Fig. 9.
icon on the
shortcuts toolbar. This will display the helpset in a browser as shown in Fig. 9.
Figure 9
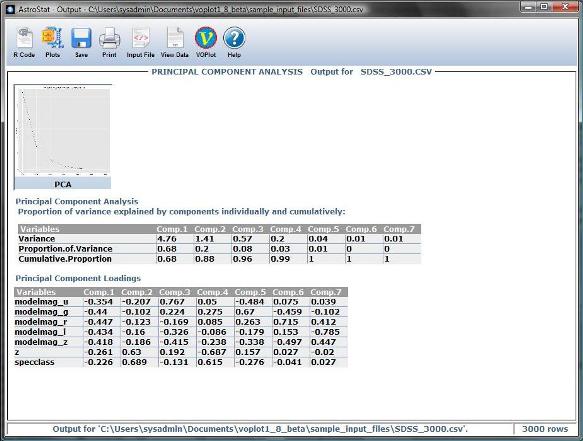
After pressing the "Run Test" button for current test, the statistical computations are performed by AstroStat and results returned to the user in form of new window as shown in Fig. 10.
Depending upon the currently selected test, output of test may contains only text output or only output images or both.
Figure 10
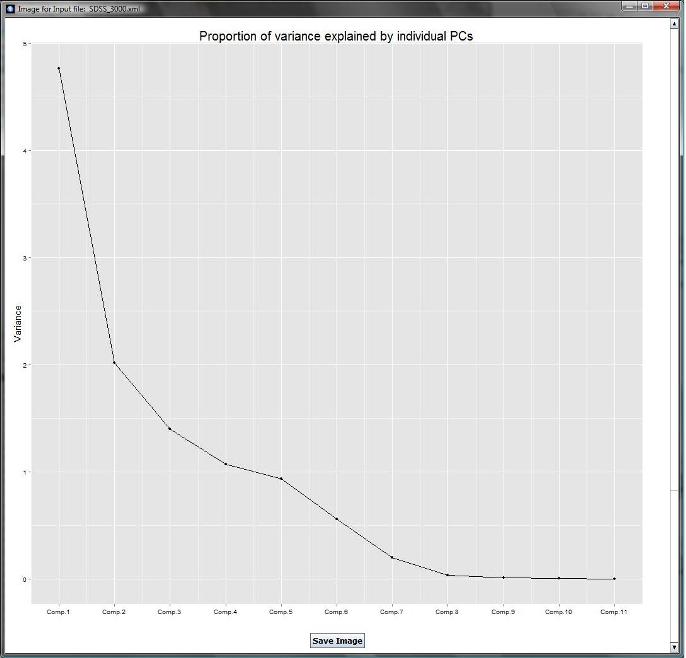
All generated images (plots) will be displayed in a thumbnail view, and on clicking this, a larger image will be displayed.
To view PostScript or PDF images, user has to save these images locally. Then through respective viewing software's these images can be seen by the user.
JPEG and PNG images can be viewed directly by user as shown in Fig. 11. Which also includes the option for saving currently viewed image.
Figure 11
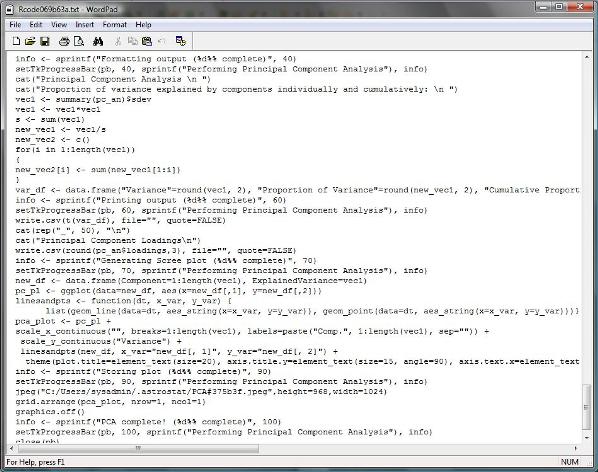
To execute each test in AstroStat a
statistical code is internally generated written in R language. User can view
this R code by pressing "R Code" icon  on menu bar.
Fig. 12 shows example of sample R Code.
on menu bar.
Fig. 12 shows example of sample R Code.
Figure 12
The test result may contains text
output or the images. By clicking on "Save"  icon on menu
bar user can save text output of the test. This will open a new dialog box
asking for saving the output file. The default name of file
is "ROutput.Txt". While saving the file user can provide any other file name.
icon on menu
bar user can save text output of the test. This will open a new dialog box
asking for saving the output file. The default name of file
is "ROutput.Txt". While saving the file user can provide any other file name.
If user wants to see the loaded original input file click "View File"
icon  provided on menu bar.
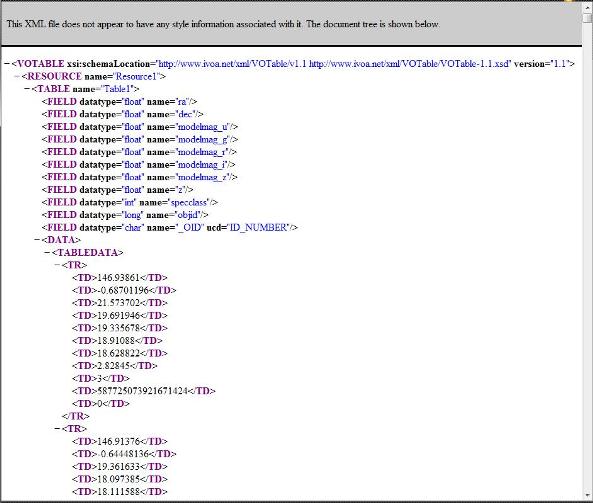
Fig. 13 shows example of sample input VOTable (XML) file. The file can be viewed in new opened window as shown in fig below.
Figure 13
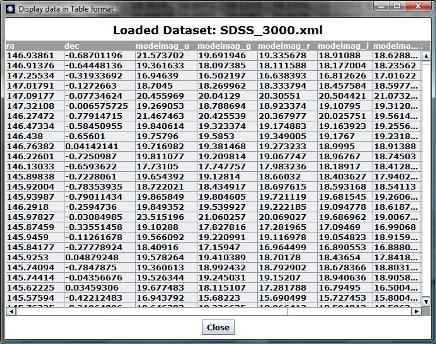
User can also able to see a tabular representation of
the data contained in the input file by clicking "View Data"  option
provided on the menu bar. The data can be viewed in new opened window as shown
in fig below.
option
provided on the menu bar. The data can be viewed in new opened window as shown
in fig below.
Figure 14
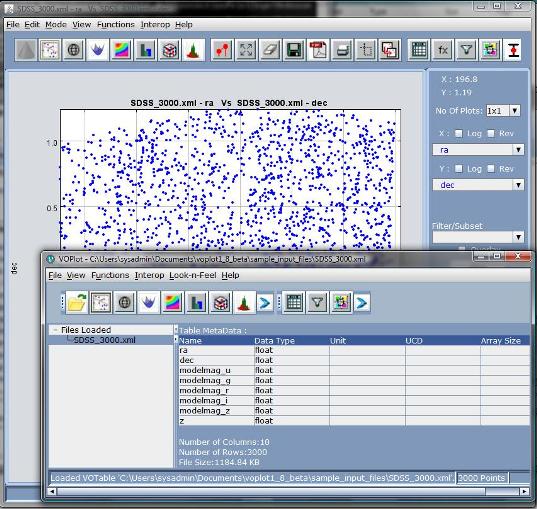
VOPlot is a tool for visualizing astronomical data. It can be used for
plotting different astronomical graphs using data stored in VOTable format. From
AstroStat, user can invoke the VOPlot. Once the input file loaded successfully user
can click on "VOPlot" icon  on menu
bar.
on menu
bar.
This will open new window of
VOPlot as shown in Fig. 15.
Figure 15
AstroStat makes use of add-on R packages which will be downloaded and installed at runtime as the user runs routines which make use of these packages.
These packages are used to improve the quality of plots and incorporate support for advanced statistical tests, which are not present in the default version of R.
Time taken for package installation might vary depending on internet speed.
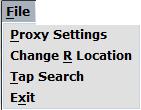
The user can change both proxy settings as well as existing R path. This can be done on options provided in File option of menu bar as shown in Fig.16. Generally changing the R path might be required if user installs a newer/higher version of R.
Figure 16
Proxy settings are required to be entered if your local network makes use of a proxy server to connect to the internet. The 'Proxy Settings' option will open a dialog box which allows you to enter the Proxy hostname, Proxy port and a list of addresses for which proxy is not to be used. It also allows you to save authentication details if your proxy server requires the use of username and password
Figure 17
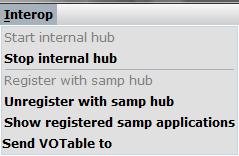
When AstroStat is launched, if there is no SAMP hub running, it will automatically start a hub and register to it. One can stop or start a SAMP hub from the 'Stop internal hub' and 'Start internal hub' options in the Interop menu.
The InterOp menu also allows you to connect/disconnect from a running SAMP hub using the 'Register with samp hub' and 'unregister with samp hub' options, while the 'Show registered samp applications' option will allow you to view applications that are are connected to the hub and can be communicated with. to it.
Data can be transmitted to other applications by using the 'Send VOTable to' option and choosing any or all registered application from the list. Note that this options will transmit the data-set which is currently selected in the 'Loaded datasets' box.
Figure 18
We would be happy to receive any feedback/comments on AstroStat. For feedback and comments please contact voindia@iucaa.ernet.in.
Top