To open an empty canvas for plotting a 2D histogram, click on View --> 2D Plots --> Histogram Plot or click on the 2D histogram button ![]() ,
on the main launcher.
,
on the main launcher.
To draw the 2D histogram of a column,
- Select the column from the X-axis dropdown menu.
- Click the Plot button.
A sample histogram is shown in Figure 10.
Figure 10

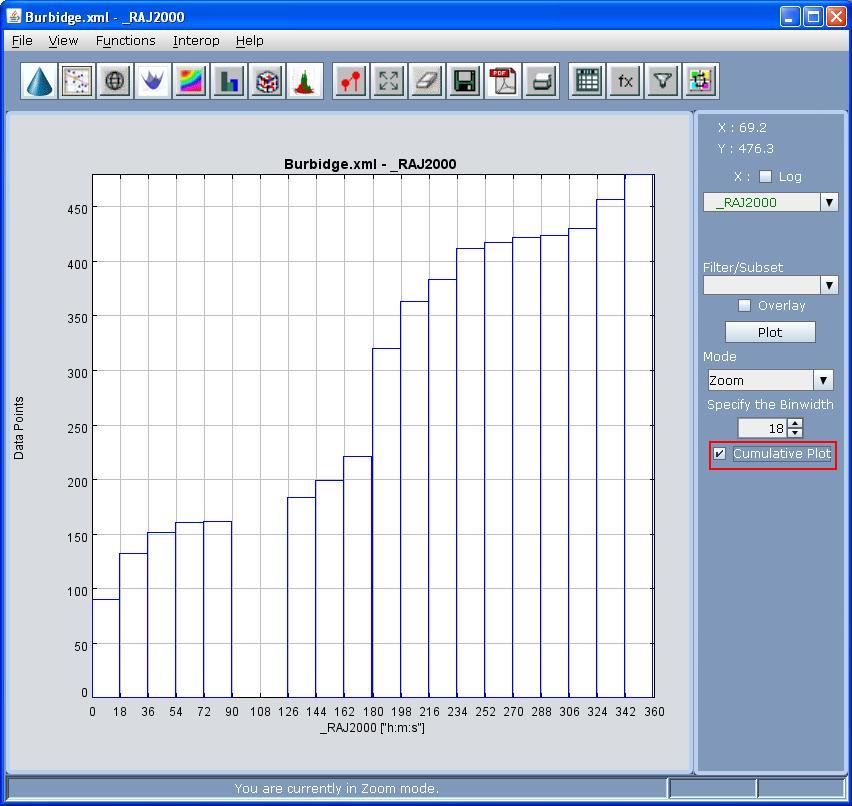
VOPlot now also supports a new type of histogram i.e the cumulative histogram. A sample cumulative histogram is shown below
The attributes of the histogram such as bin-width etc can be changed by going to View --> Plot Properties or clicking on the ![]() button as usual.
button as usual.
The bin-width can also be manipulated using the buttons on the right hand side of the frame.
If you want to plot the histogram of data points on a log scale, then check the Log checkbox corresponding to the X-axis