To change the plot properties click on the View --> Plot Properties menu or the Plot Properties button , which opens the "Plot Properties" dialog as shown in Figure 6.
For changing properties such as Title, X label, Y label etc. click on the Simple tab.
Figure 6

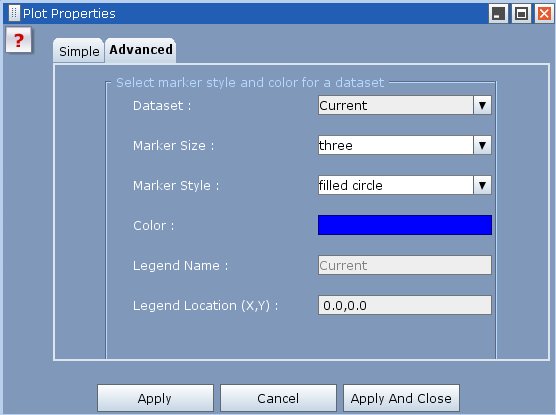
For changing properties like color and marker style click on the Advanced tab
To change the marker styles for all columns select Dataset as ALL Datasets.
To change marker style or color for currently plotted columns select Dataset as Current Dataset.
You can choose various marker styles such as pixels, points, triangle, rectangle etc.
Figure 7