Plotting Scatter Plots
Click on View -- 2D Plots-- Scatter Plot to obtain an empty canvas for drawing a 2D scatter plot. You can also do the same by clicking on
the 2D scatter plot icon on the main launcher ![]()
Now, to draw a plot of one column against the other
- Select the column to be plotted on the X-axis.
- Select the column to be plotted on the Y-axis.
- Click "Plot" button.
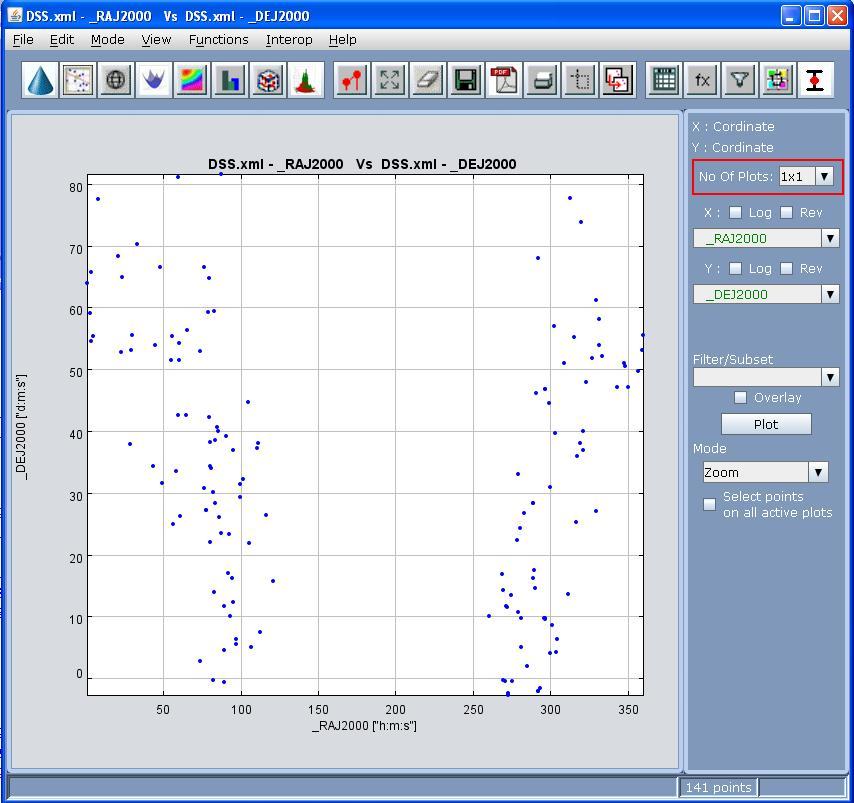
You can see the scatter plot. We can also plot SM like multi-grid scatter plots with a default grid size of 1x1 as shown in Figure 5.
Note that VOPlot 1.8 Beta allows you to plot a column from one VOTable against column from another VOTable as long as the number of rows in the two VOTables are the same.The responsibility for ensuring a one-to-one correspondence between the rows of the two VOTables lie with the user
If required, you can plot data points on a log scale by setting the option appropriately using the "Log" checkbox. Also, by checking the "Rev" checkbox, the data points are plotted on a reverse scale.
Scatter plot uses pixels for plotting if the number of points is more than 100000.
Figure 5
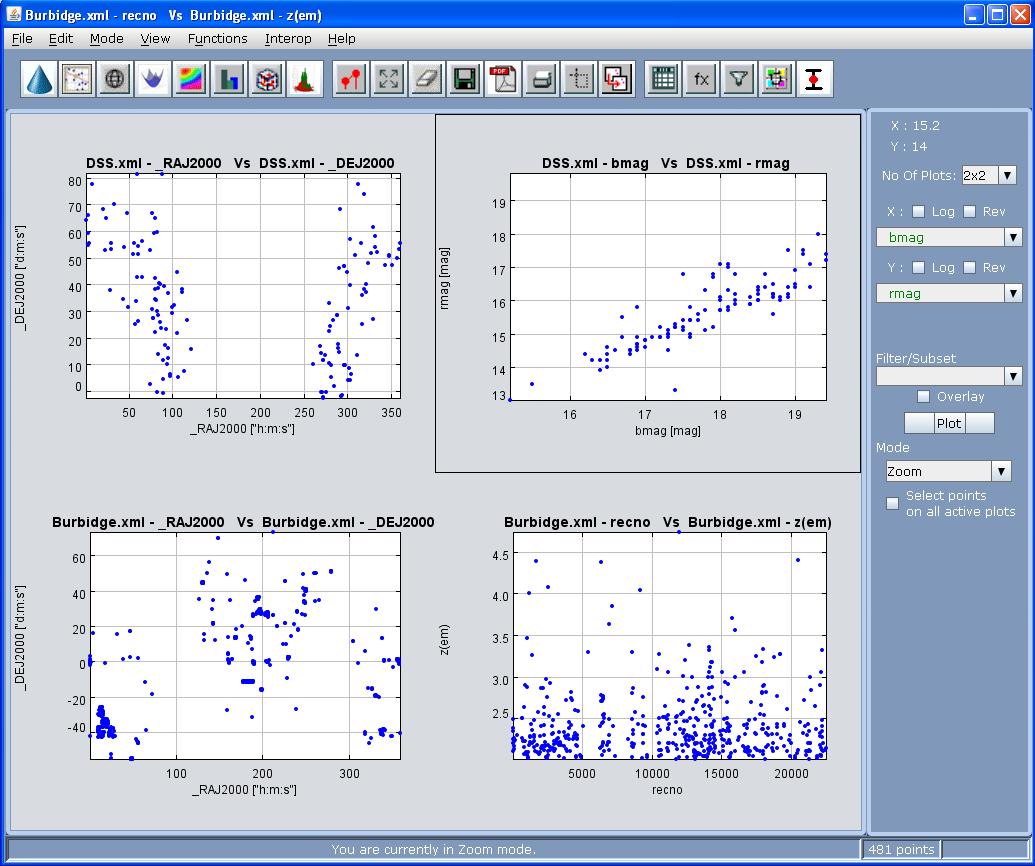
Multi-Grid Plots
You can change the grid size from 1x1 to 3x3 and the plots are shown accordingly.You can switch between the plots just by clicking on the respective plot and the plot becomes active. The plots in the grid are independant in nature and are useful to analyse in the same window. All the buttons and functions apply to the currently active plot which is shown by a black border. A sample 2x2 grid with second plot active is shown in the following figure.