To draw a plot with error bars, click on the View --> Plot with error bars menu in the 2D Scatter plot
window or by clicking on the error bar button ![]() on the same window.
on the same window.
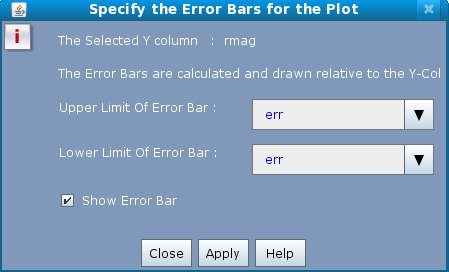
This will open the Error bars dialog. By default E_ABC(Upper case) or e_ABC(Lower case) are chosen as default columns for the error limits, where ABC is the Y-Column.
E_ABC contains the error then the error bar is drawn between ABC - E_ABC(The lower limit of the error bar) and ABC + E_ABC(The upper limit of the error bar).
You can choose any other columns as well for upper and lower error limits.
The Error bars dialog is shown below in Figure 8.
Figure 8
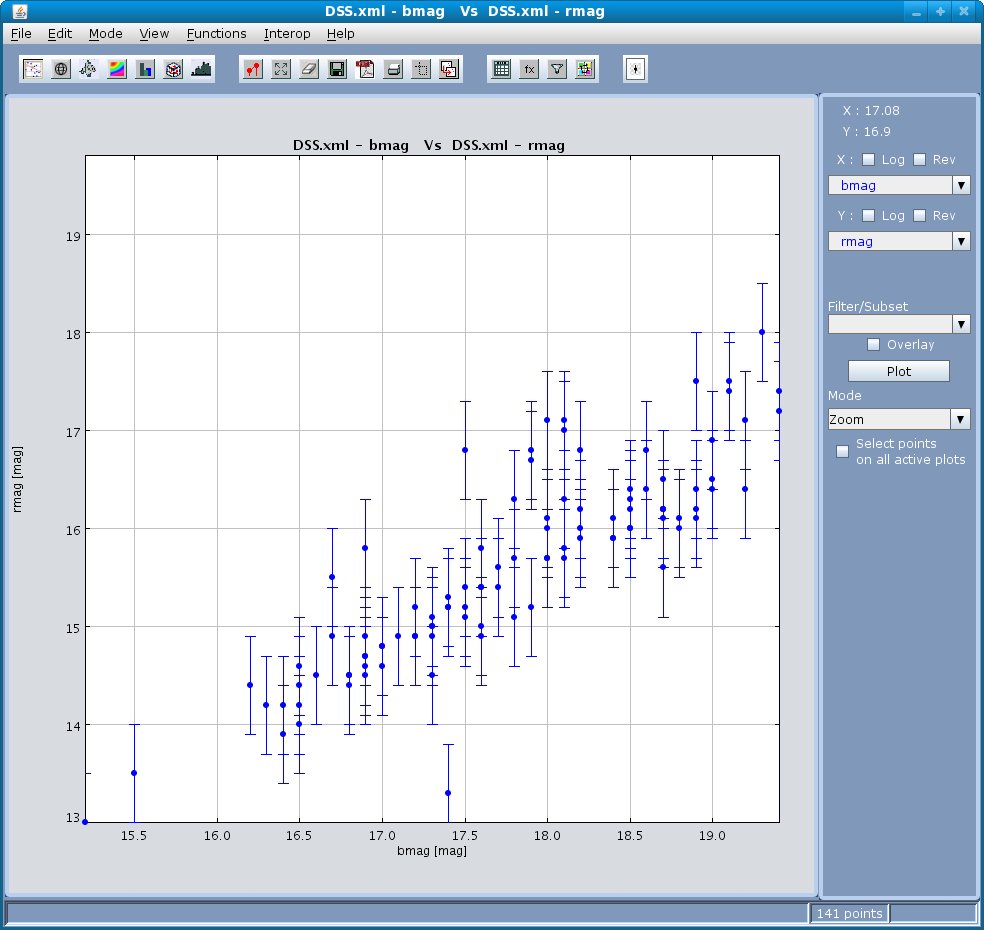
A Sample plot with error bars is shown below in Figure 9.
Note : Error bars are only provided for the column on the Y-axis.
Figure 9