VOStat (Version 1.1 Beta)
Statistical Analysis for the Virtual Observatory
|
VOStat (Version 1.1 Beta) Statistical Analysis for the Virtual Observatory |
The standalone version of the VOStat (Statistical Tool) is a java based tool allowing astronomers to use both simple and sophisticated statistical routines on large datasets. It's web-based version is available at http://vo.iucaa.ernet.in/cgi-bin/VOStatBeta1/stats1.cgi. The standalone version can be downloaded from http://vo.iucaa.ernet.in/~voi/VOStat.html.
VOStat was originally developed by a NSF focused group research team led by Penn State and consisting of Caltech and CMU. The development of new versions of VOStat is undertaken jointly by Virtual Observatory - India and the Center for Astrostatistics at Penn State, with contributions from CalTech and Calcutta University Statistics Department.
Click here for disclaimer information.
Third Party Tools
1. VOStat makes use of a large public-domain statistical computing package called R.
2. VOStat makes use of SAVOT parser for parsing of the VOTable files.
The standalone version requires R-2.5.0 or higher version to be installed on the local machine.
System Requirements
Java : To run VOStat you must have JRE 1.4.2 or higher version
To check version of java on your machine, you can use the following command on the command line
java -version
R: R-2.5.0 or higher version is to be installed on local machine.
Installed R location
In Windows operating system, the default location of R executable is "C:\Program Files\R\R-2.5.0\bin\R.exe"
In Linux operating system the user can find the location of R executable by typing command "which R" on the terminal.
Starting Instructions
To use the standalone version of VOStat, you will need to download the executable jar file named VOStat.jar. The file can be executed by typing the following command at the command prompt.
java -jar VOStat.jar
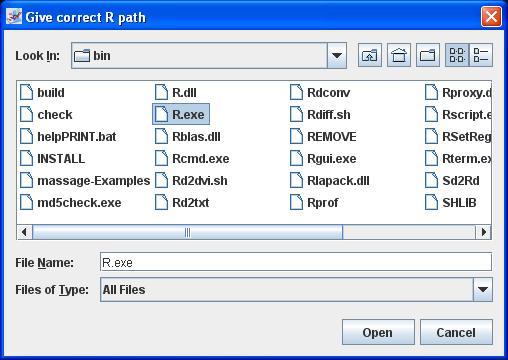
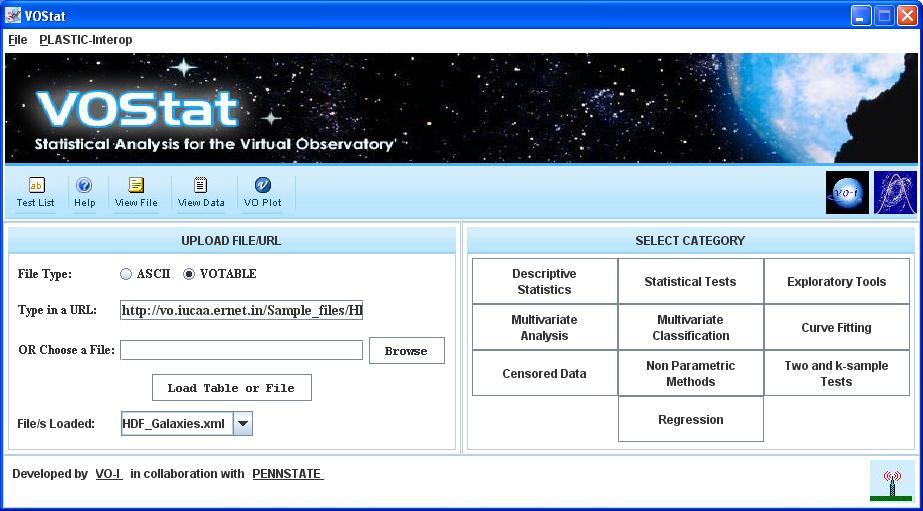
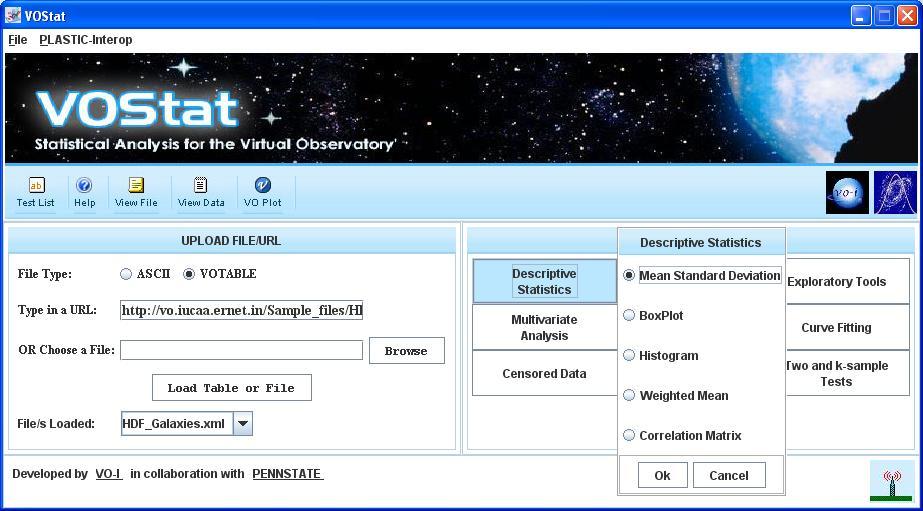
Running the application for first time opens a input dialog asking for locally installed location of R (path of R executable) as shown in the Fig. 0. The prerequisite to run VOStat is software R which should be already installed on the machine. After validating correct R path, a java application window will be open as shown in the Fig. 1. To perform statistical computations, you will need to load input datasets first. Datasets can be uploaded in either ASCII or VOTABLE format. You can specify either the URL of dataset or the path of a dataset on your machine by using the Browse button. Then click on the Load Table or File button to validate the input dataset. The name of valid input dataset will be displayed below the load button.

If user can load the file from an URL by specifying the URL in URL field. After pressing load button, a small window will be display as shown in Fig. 2 asking for proxy. Specify Address and Port number for proxy settings otherwise cancel the proxy window for no proxy. A small progress bar will be displayed indicating getting the file from the specified URL. After getting the valid file from URL, name of file will be displayed below the load button as shown in Fig 3.
Figure 2
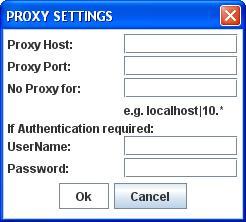
Figure 3
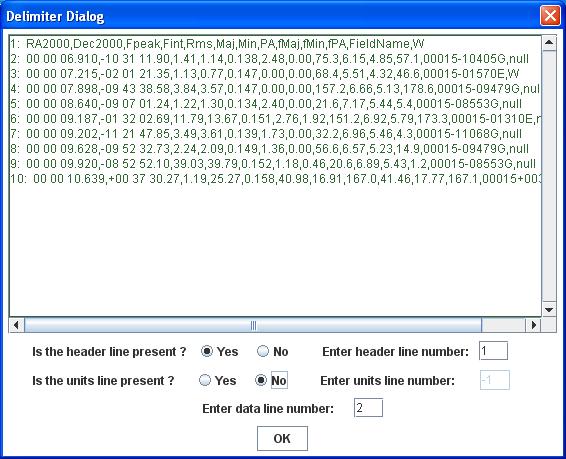
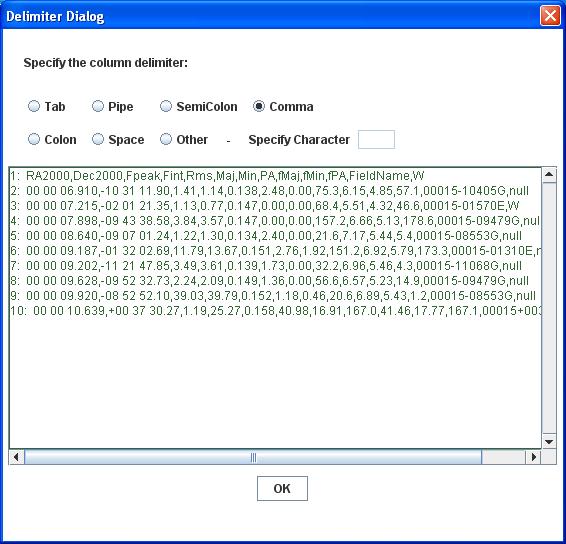
The ASCII file can be loaded either from specified URL or from local machine. For loading a ASCII file, select the "ASCII" option first. Select some ASCII file through URL or from local machine. On clicking "Load Table or File" button, the user is asked for some information before loading the ASCII file.
Sample screens are shown below.
Figure 4 Figure 5
The application includes ten different categories and each category includes its own list of tests. On moving the mouse on those categories, a list of tests will be displayed in form of small test list window for each category as shown in Fig. 6. To select particular test, you have to select the corresponding category first.
Figure 6
To select the category click on the desired category. This will stop the test list window on selected category. Unless the user selects "Ok" or "Cancel" buttons from test list window, the window will not disappear stopping further category selection. Selecting "Cancel" button disappear test list window and new category will be selected again by clicking the mouse of required category. Selecting "Ok" button from test list window will load the selected test.
To select a particular test,
Figure 7
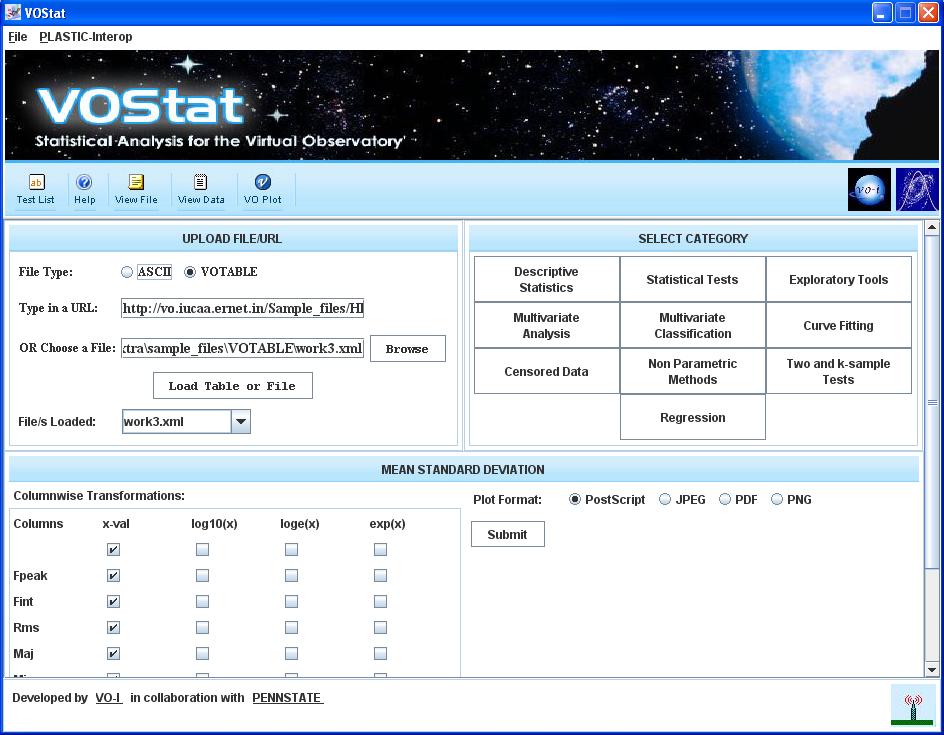
After pressing the "Submit" button for current test, the statistical computations are performed by the VOStat and results returned to the user in form of new window as shown in Fig. 8.
Depending upon the currently selected test, output of test may contains only text output or only output images or both.
Figure 8
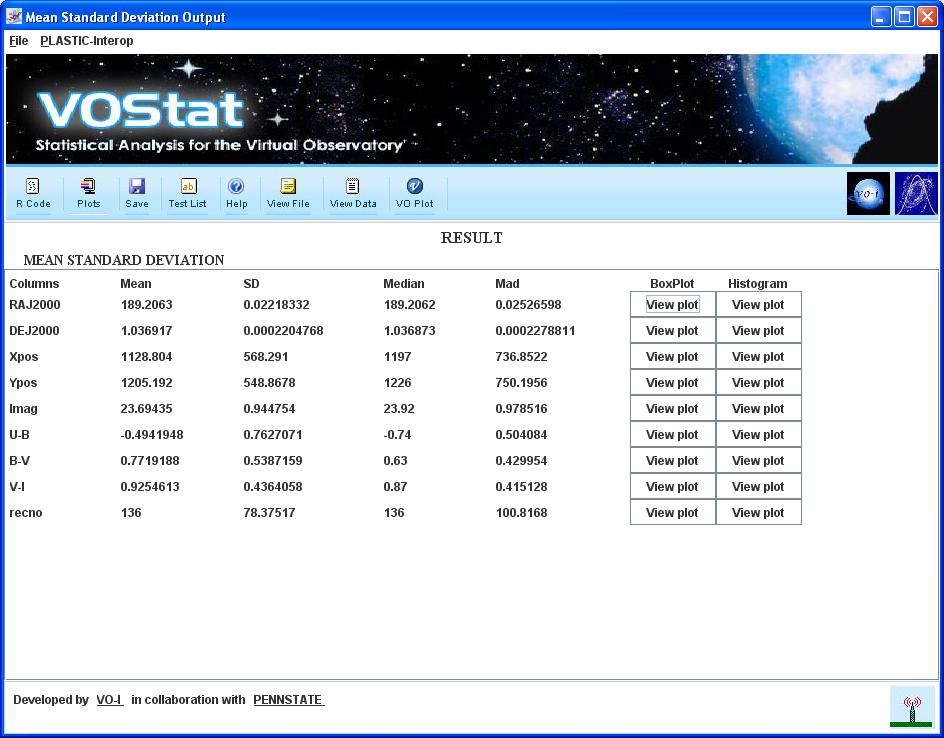
By clicking "View Plot" button any user can able to see the images.
The generated image output will depend upon selected image options at time of submitting the test.
To view PostScript or PDF images, user has to save these images locally. Then through respective viewing software's these images can be seen by the user.
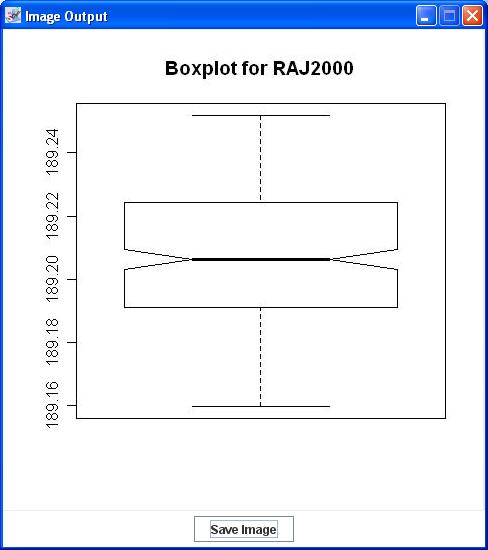
JPEG and PNG images can be viewed directly by user as shown in Fig. 9. Which also includes the option for saving currently viewed image.
Figure 9
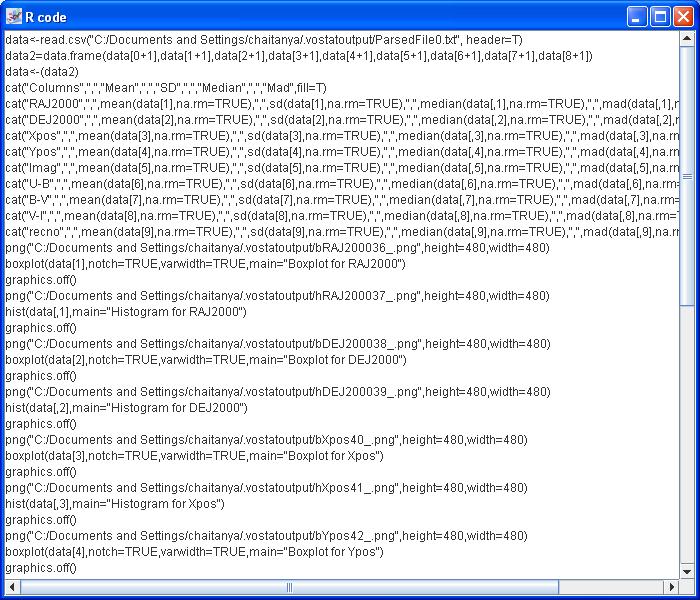
To execute each test in VOStat a
statistical code is internally generated written in R language. User can view
this R code by pressing "R Code" icon ![]() on menu bar.
Fig. 10 shows example of sample R Code.
on menu bar.
Fig. 10 shows example of sample R Code.
Figure 10
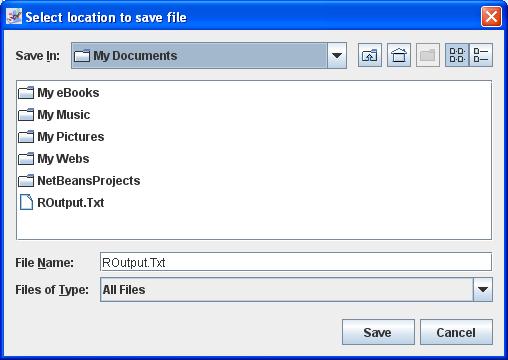
The test result may contains text
output or the images. By clicking on "Save" ![]() icon on menu
bar user can save text output of the test. This will open a new dialog box
asking for saving the output file as shown in Fig. 11. The default name of file
is "ROutput.Txt". While saving the file user can provide any other file name.
The figure below shows sample example.
icon on menu
bar user can save text output of the test. This will open a new dialog box
asking for saving the output file as shown in Fig. 11. The default name of file
is "ROutput.Txt". While saving the file user can provide any other file name.
The figure below shows sample example.
Figure 11
For saving all images present in
test output user has to click "Plots" ![]() icon on menu
bar which stored all images. This will open a new dialog box asking for
selecting the directory to save all output images as shown in figure below.
icon on menu
bar which stored all images. This will open a new dialog box asking for
selecting the directory to save all output images as shown in figure below.
Figure 12
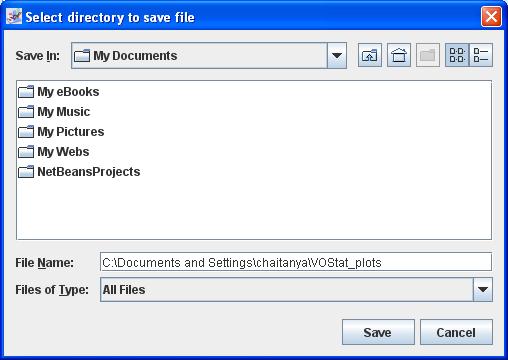
Figure 13
If you need help for currently selected test, click "Help" icon ![]() provided on menu bar.
provided on menu bar.
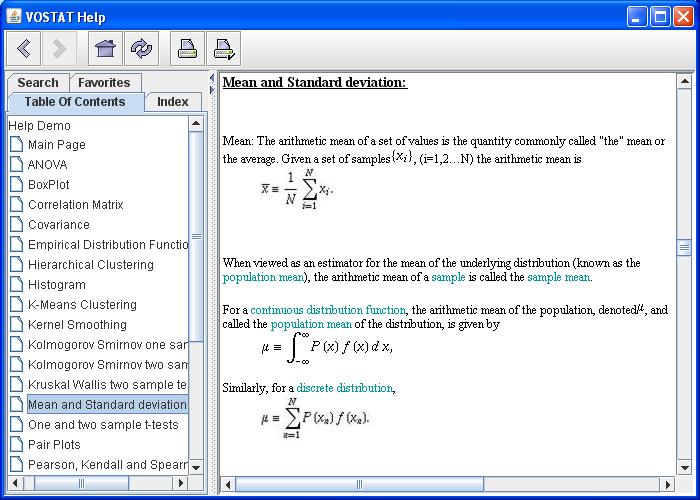
Fig. 14 shows example of Mean Standard deviation test. The help for the test opened in new window as shown in fig below.
Figure 14
If user wants to see the loaded original input file click "View File"
icon ![]() provided on menu bar.
provided on menu bar.
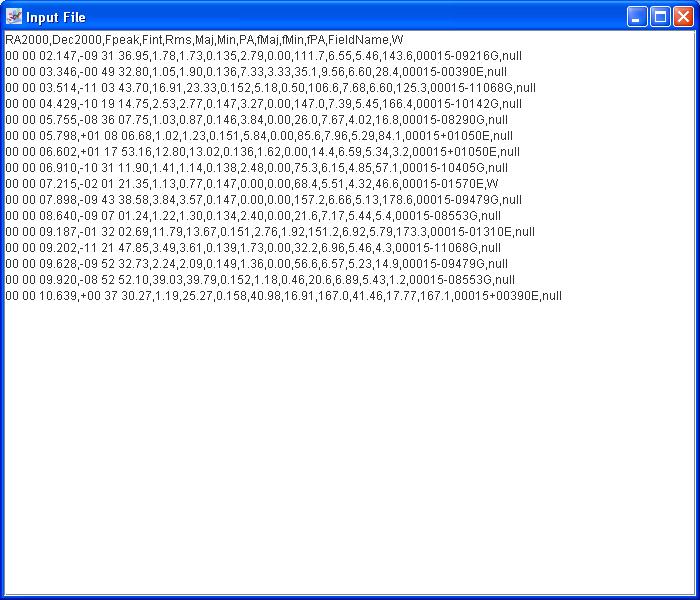
Fig. 15 shows example of sample input ascii file. The file can be viewed in new opened window as shown in fig below.
Figure 15
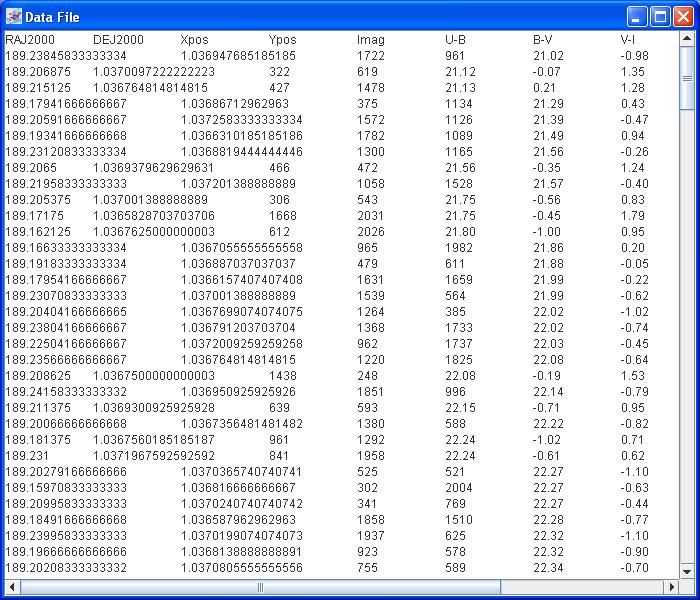
User can also able to see the
statistical data inside the input file by clicking "View Data" ![]() option
provided on the menu bar. The data can be viewed in new opened window as shown
in fig below.
option
provided on the menu bar. The data can be viewed in new opened window as shown
in fig below.
Figure 16
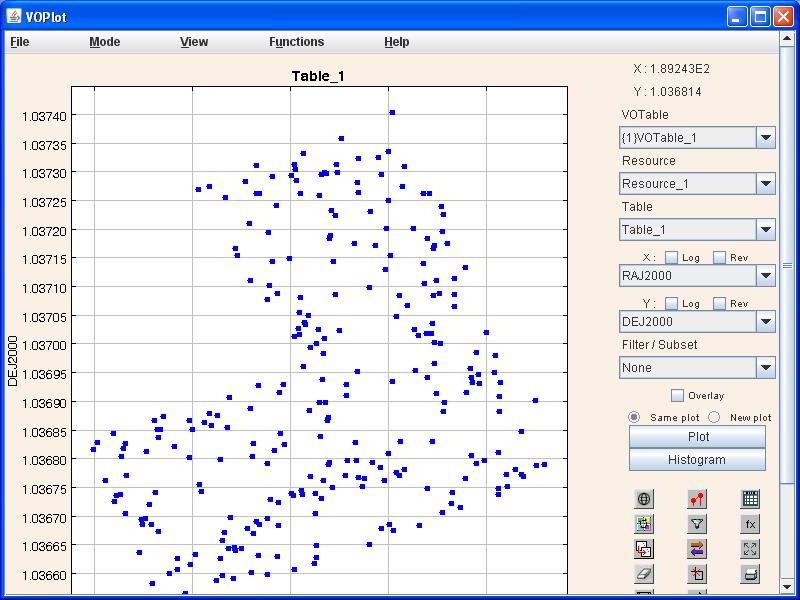
VOPlot is a tool for visualizing astronomical data. It can be used for
plotting different astronomical graphs using data stored in VOTable format. From
VOStat, user can invoke the VOPlot. Once the input file loaded successfully user
can click on "VO Plot" icon ![]() on menu
bar.
on menu
bar.
This will open new window of
VOPlot as shown in Fig. 17.
Figure 17
To run some tests like Probability plot or Correlation Matrix test, user needs to installed extra R packages like "Hmisc" or "e1071".
These packages can be installed through R only. The package can be installed either from CRAN mirror list present in Install package of R or one can install it from local zip files.
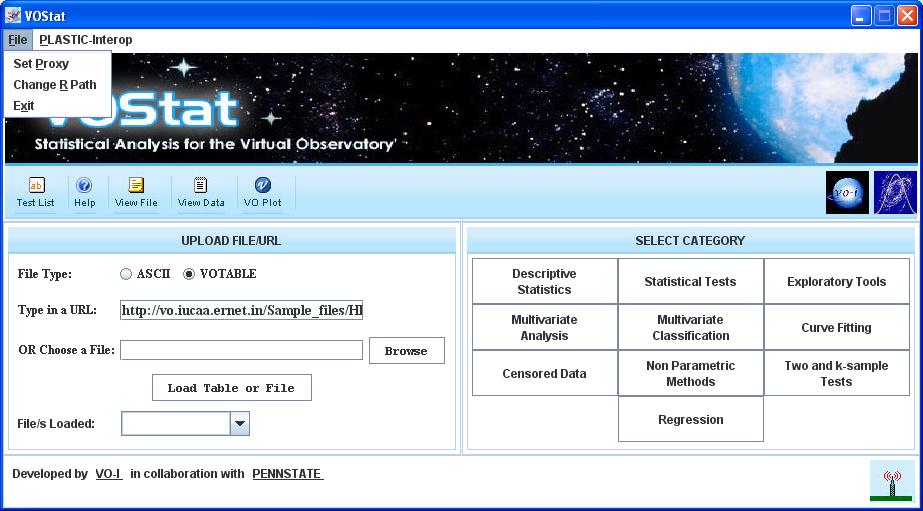
The user can change both proxy settings as well as existing R path. This can be done on options provided in File option of menu bar as shown in Fig.18. Generally changing the R path required if user installed newer/higher version of R.
Figure 18
If there is no PLASTIC hub running.One can start internal PLASTIC hub of VOStat.
If any external hub is running , on launch VOstat will get connected to it. Or using 'Connect to PLASTIC Hub' one can connect to Hub.
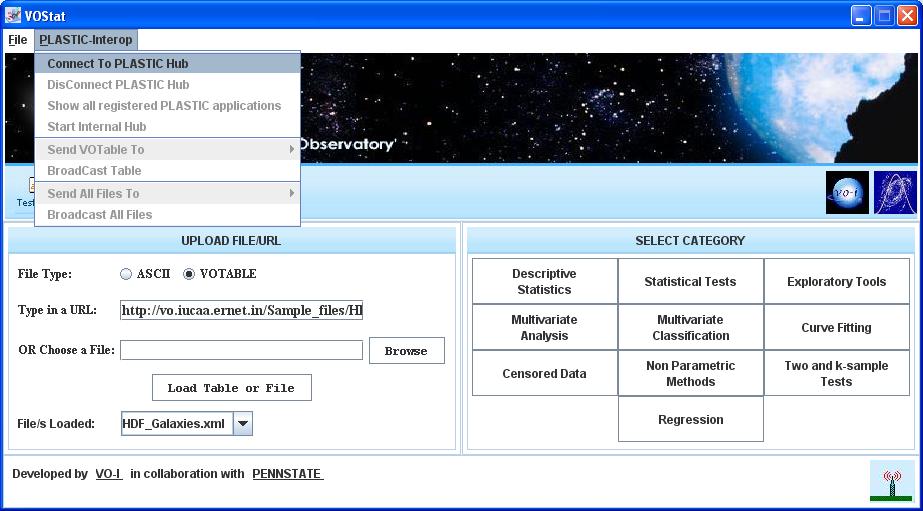
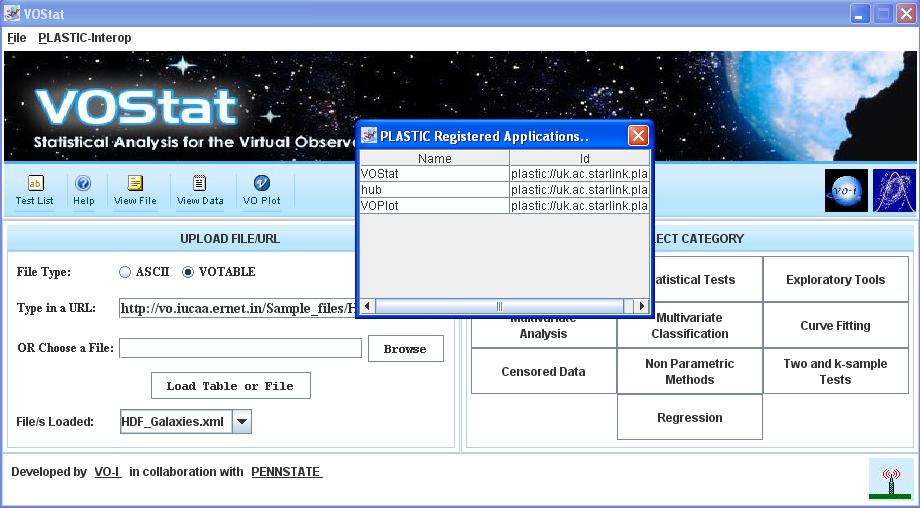
Once connected to Hub. You can see all registered applications to the PLASTIC hub clicking on 'Show All registered PLASTIC Applications'

If user wants to send input data to other application, it can be done via PLASTIC using 'Send VOTable to' or 'BroadCast VOTable' menu options
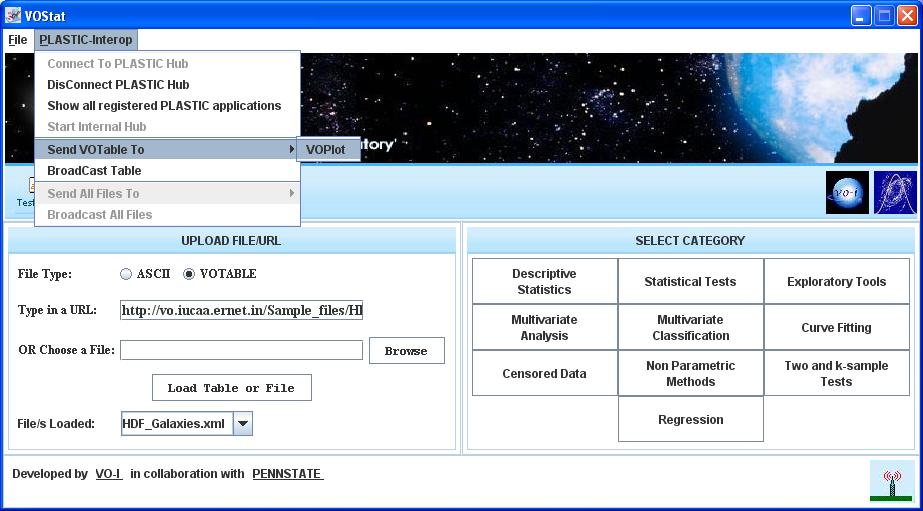
To send input file to more than one registered application use option 'Broadcast Table'.
To send more than one files at a time one can use 'Send All Files to' or 'Broadcast All Files' menu options
We would be happy to receive any feedback/comments on VOStat. For feedback and comments please contact voindia@vo.iucaa.ernet.in.
Top