Next: Plot Properties
Up: Plot Functionality
Previous: Common to All Plots
Contents
Subsections
Overlay is possible in all types of plots except Surface Plot.
To overlay 3D plots (simultaneously viewing multiple plots with similar
range on the same axes system)
- Select column to be plotted on the X-axis.
- Select column to be plotted on the Y-axis.
- Select column to be plotted on the Z-axis.
- Click on ``3D Scatter Plot'' icon
 of the toolbar.
- Select column to be plotted on X-axis (represents another plot).
- Select column to be plotted on Y-axis (represents another plot).
- Select column to be plotted on Z-axis (represents another plot) .
- Set the "Overlay" option.
- Click on ``3D Scatter Plot'' icon
of the toolbar.
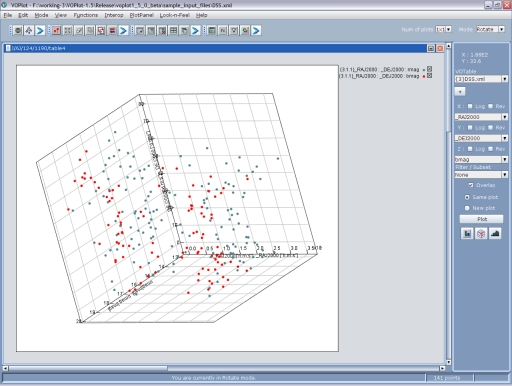
A different marker will be used for each plot, to allow one to differentiate
between the plots.
Example of overlayed 3D Scatter Plot is shown in Figure 6.
Figure 6:
Overlayed 3D Scatter Plot
|
|
To overlay histograms (simultaneously viewing multiple histograms
with similar range)
- Select column to be plotted on the X-axis.
- Select column to be plotted on the Z-axis.
- Click on ``3D Histogram'' icon
 of the toolbar.
- Select column to be plotted on X-axis (represents another plot).
- Select column to be plotted on Z-axis (represents another plot).
- Set the "Overlay" option.
- Click on ``3D Histogram'' icon
of the toolbar.
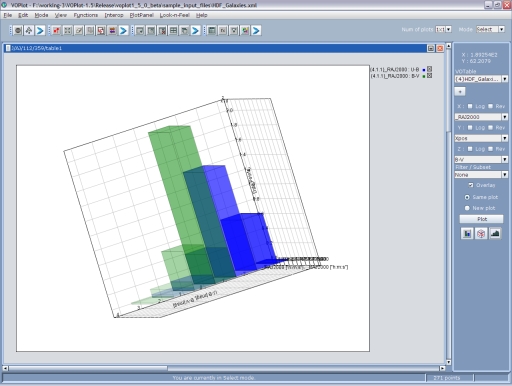
A different color will be used for each histogram, to allow one to
differentiate between the histograms.
Example of overlayed 3D histogram is shown in Figure 7.
Figure 7:
Overlayed 3D Histogram
|
|
Next: Plot Properties
Up: Plot Functionality
Previous: Common to All Plots
Contents