Next: Scatter 2D/3D & Projection
Up: Plot Functionality
Previous: Overlay
Contents
Subsections
Change of Plot properties can be done in any kind of of plot
2D Histogram:
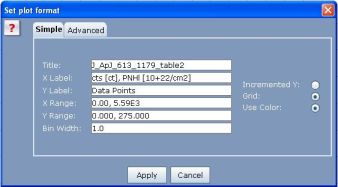
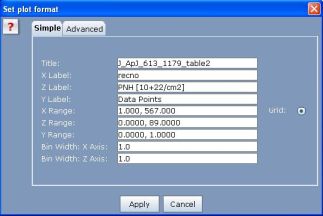
To change the plot properties click on the "View -> Plot
Properties" menu or the plot properties button  ,
this opens the ``Set Plot format''
dialog as shown in figure given below.
,
this opens the ``Set Plot format''
dialog as shown in figure given below.
For changing properties such as title of the plot, labels, and ranges,
click on the "Simple" tab.
Figure 8:
2D Histogram: Properties
Dialog (Simple tab)
|
|
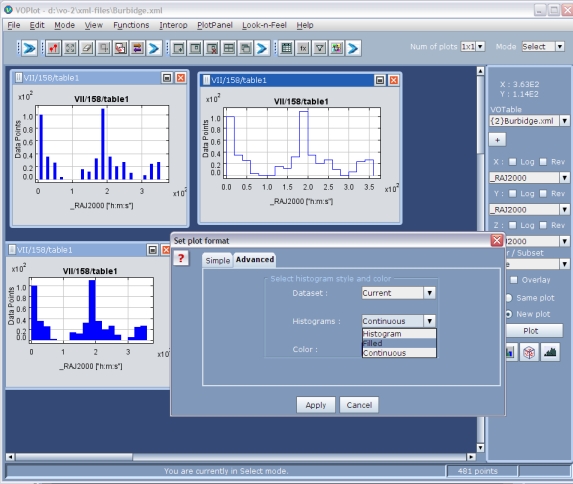
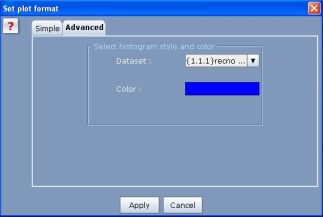
For changing properties like color and histogram type click on the
"Advanced" tab. These properties can be changed
in two ways:
- Selecting a particular dataset in ``Dataset''
combobox and changing color and/or histogram types will change the
properties of only that particular dataset.
- Selecting ``All Datasets'' in ``Dataset''
combobox and changing color and/or histogram types modifies the same
of the plots overlayed (if any) and plots that will be overlayed in
the same plot panel.
The option ``various'' is enabled
in histogram type combobox only when ``All Datasets''
option is selected in Dataset combobox. If histogram type is set to
``various'', all the datasets type
plotted in corresponding plot are made different.
When ``All Datasets'' is selected
in ``Dataset'' combobox, an option
to ``Apply changes to All Plots''
is enabled. Enabling this feature applies property of respective plot
panel to all the plot panels present with histogram plotted and even
that will be created newly.
To use transparent colors vary the alpha value in the color chooser
box which pops up by clicking the colored button with label Color:
Figure 9:
2D Histogram: Properties
Dialog (Advanced tab)
|
|
To change the plot properties click on the "View -> Plot
Properties" menu or the plot properties button ,
this opens the ``Set Plot format''
dialog as shown in figure given below.
For changing properties such as title of the plot, labels, and ranges,
click on the "Simple" tab.
Figure 10:
3D Scatter Plot: Properties
Dialog (Simple tab)
|
|
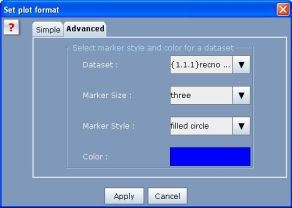
For changing properties like color, marker style and marker size click
on the "Advanced" tab. These properties can be changed
in two ways:
- Selecting a particular dataset in ``Dataset''
combobox and changing color, marker size and/or marker style will
change the properties of only that particular dataset.
- Selecting ``All Datasets'' in ``Dataset''
combobox and changing color, marker size and/or marker style modifies
the same of the plots overlayed (if any) and plots that will be overlayed
in the same plot panel.
The option ``various'' is enabled
in marker size and style comboboxes only when ``All
Datasets'' option is selected in Dataset combobox.
If marker size and/or style are(is) set to ``various'',
all the datasets marker size and/or style plotted in corresponding
plot are made different.
When ``All Datasets'' is selected
in ``Dataset'' combobox, an option
to ``Apply changes to All Plots''
is enabled. Enabling this feature applies property of respective plot
panel to all the plot panels present with 3D scatter plot plotted
and even that will be created newly.
To use transparent colors vary the alpha value in the color chooser
box which pops up by clicking the colored button with label Color:
Figure 11:
3D Scatter Plot: Properties
Dialog (Advance tab)
|
|
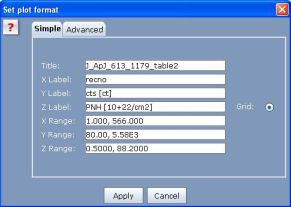
To change the plot properties click on the "View -> Plot
Properties" menu or the plot properties button ,
this opens the ``Set Plot format''
dialog as shown in figure given below.
For changing properties such as title of the plot, labels, and ranges,
click on the "Simple" tab.
Figure 12:
3D Histogram: Properties
Dialog (Simple tab)
|
|
For changing properties like color and histogram type click on the
"Advanced" tab. These properties can be changed
in two ways:
- Selecting a particular dataset in ``Dataset''
combobox and changing color and/or histogram types will change the
properties of only that particular dataset.
- Selecting ``All Datasets'' in ``Dataset''
combobox and changing color and/or histogram types modifies the same
of the plots overlayed (if any) and plots that will be overlayed in
the same plot panel.
The option ``various'' is enabled
in histogram type combobox only when ``All Datasets''
option is selected in Dataset combobox. If histogram type is set to
``various'', all the datasets type
plotted in corresponding plot are made different.
When ``All Datasets'' is selected
in ``Dataset'' combobox, an option
to ``Apply changes to All Plots''
is enabled. Enabling this feature applies property of respective plot
panel to all the plot panels present with histogram plotted and even
that will be created newly.
To use transparent colors vary the alpha value in the color chooser
box which pops up by clicking the colored button with label Color:
Figure 13:
3D Histogram: Properties
Dialog (Advance tab)
|
|
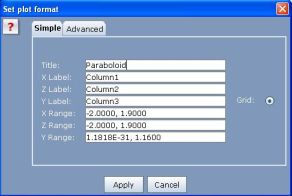
To change the plot properties click on the "View -> Plot
Properties" menu or the plot properties button ,
this opens the ``Set Plot format''
dialog as shown in figure given below.
For changing properties such as title of the plot, labels, and ranges,
click on the "Simple" tab.
Figure 14:
Surface Plot: Properties Dialog
(Simple tab)
|
|
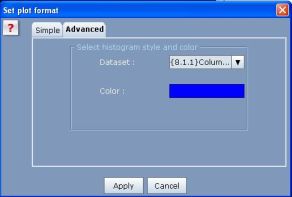
For changing properties like color and histogram type click on the
"Advanced" tab. These properties can be changed
in two ways:
- Selecting a particular dataset in ``Dataset''
combobox and changing color will change the properties of only that
particular dataset.
- Selecting ``All Datasets'' in ``Dataset''
combobox and changing color modifies the same of the plots overlayed
(if any) and plots that will be overlayed in the same plot panel.
To use transparent colors vary the alpha value in the color chooser
box which pops up by clicking the colored button with label Color:
Figure 15:
Surface Plot: Properties Dialog
(Advance tab)
|
|
Next: Scatter 2D/3D & Projection
Up: Plot Functionality
Previous: Overlay
Contents